Loading
Before the Russian invasion of Ukraine on 24 February, global equities were already facing their first critical event as inflation began to accelerate. This risk continues, as inflation recently reached 40-year highs in the wake of a global pandemic, government spending and years of endless money printing with near-zero interest rates.
During the same period, Treasuries suffered their worst quarterly selloff since 1973. In addition, the 10-year T-note saw its seventh worst quarter since the US Civil War, which occurred despite the asset’s safe haven status. This particular selloff was driven by the prospects of higher interest rates in the future, which would eat into current yields for existing long-term maturities.
In addition, the Treasury yield curve has been inverted in the last three recessions, causing some market participants to expect a coming recession.
But copper, the metal frequently used for wiring cars and in home construction, as well as a component in a wide selection of consumer electronic products, also acts as a hedge against recession. The price of the red metal tends to rise ahead of the prices of consumer products – not surprising given that it is a key component of many of these products, thus contributing to their higher price.
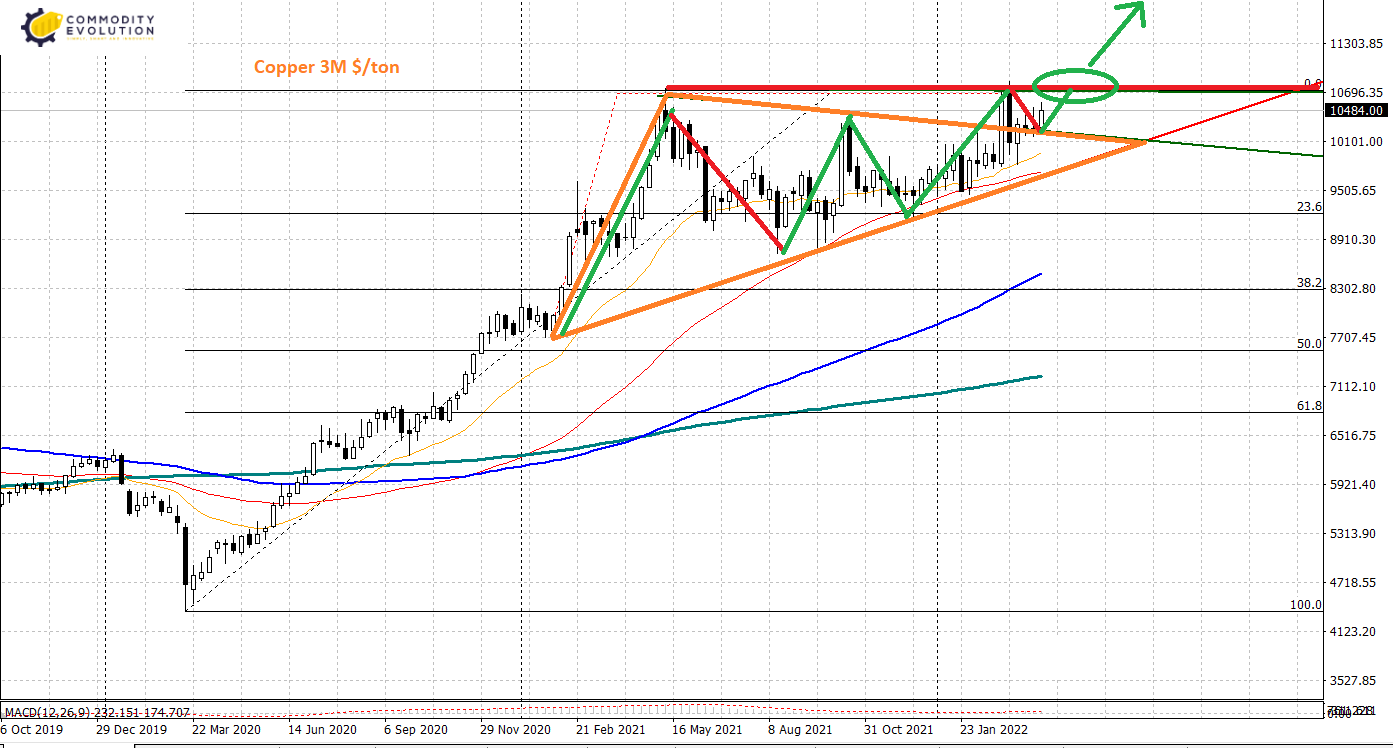
As mentioned in the article published some time ago, exactly on 4 March (read the full article here), copper is set to extend the climb it started from the March 2020 lows, where it was around $4398/mt.
From a graphical point of view, the completion of the triangular formation, evident in the two converging orange lines on the chart, suggests a potential further price extension just beyond the first resistance barrier in the $10,720/ton area. It will be essential to keep this level monitored because its rapid and sudden violation could trigger the expected medium/long-term bullish signal.
If this were to happen, the first targets would be projected in the direction of 12,300 $/ton and 13,300 $/ton, prices currently unthinkable.