 Loading

 Commodity Evolution Newsletter | October 23, 2026
For raw-material buyers, what matters is not only how far the international quotation moves, but how much of that movement actually reaches the invoice in euros. This distinction provides the foundation for the three copper analyses that follow: European physical premiums, developments in mining production and signals from the LME market.
The ratio between current Cash quotations in the two currencies corresponds to an implied EUR/USD rate of approximately 1.1195. However, this figure does not indicate the exchange rate actually applied by each supplier, nor does it alone make it possible to reconstruct all currency conditions during the period. Currency hedges, differences in fixing times, physical premiums and indexation clauses can affect the buyer’s final cost.
The currency comparison is particularly important for European purchasing departments. The difference between copper’s monthly performance in dollars (−3.73%) and in euros (−2.24%) is 1.49 percentage points. Aluminium also shows a less severe decline in euros, despite its marked fall: −4.60% versus −6.04%.
The Euro-Dollar Exchange Rate Changes The Interpretation Of Prices
Lead stands out for its greater stability: the month stands, in the observed sample, at −1.47% in dollars and +0.04% in euros. Copper instead offers the opposite signal: following a recovery in the third week, the latest week’s decline is 2.23% in dollars and 2.12% in euros, a trend consistent with the loss of momentum described in the technical analysis that follows.
Nickel, by contrast, has shown more favourable momentum over the latest week. Despite a negative monthly balance, it has gained 7.05% in dollars and 7.17% in euros: the strongest recovery in the group, although still insufficient to bring the monthly figure back into positive territory. Looking at the sequence over time, lead’s three weeks of positive changes in dollars contrast with the persistent weakness of zinc and aluminium during the two middle weeks of the period.
The main takeaway is that the market is not experiencing a uniform correction. Tin has recorded the worst monthly performance in dollars, falling 6.91%, followed by zinc and aluminium. For the latter, the 6.04% decline is particularly relevant to industrial processing sectors, where raw-material price swings affect procurement budgets.
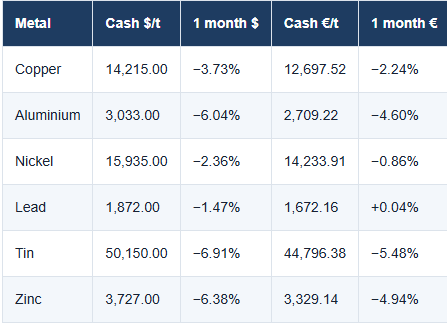
Source: Commodity Evolution, Cash fixings of 22 October 2026. Dollar and euro quotations were recorded at 14:30
Monthly Performance Of Non-Ferrous Metals
The picture changes significantly when quotations in dollars are compared with those in euros. Over the past month, all six main metals have posted a better performance in the European currency: the exchange-rate effect has helped soften the losses expressed in dollars and, in the case of lead, turn a decline into a marginally positive change.
The non-ferrous metals market reaches 22 October 2026 with a predominantly negative monthly balance, despite some signs of recovery in the latest sessions. Cash contracts show particularly pronounced weakness in tin, zinc and aluminium, while lead has demonstrated greater resilience. Copper, the focus of this newsletter’s in-depth coverage, continues to face bearish pressure that contrasts with the tensions still present in physical supply.
Copper Physical Premiums: Europe Prepares For A More Expensive 2027
The copper market enters the final part of October with three seemingly conflicting signals. In Europe, major producers are proposing record physical premiums for 2027, BHP is reporting a 19% fall in quarterly production, while the three-month LME future, after months of gains, is attempting a bearish breakout from its recent consolidation pattern. These are different dynamics, but for industrial companies they lead to the same conclusion: the exchange quotation, metal availability and actual purchase cost do not necessarily move together.
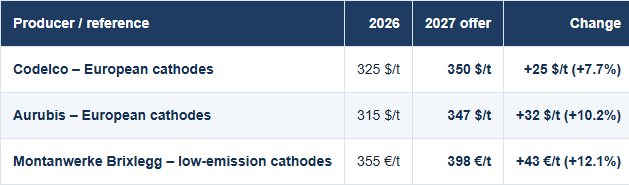
The physical premium is once again at the centre of copper negotiations. Codelco has proposed an annual premium of 350 dollars per tonne for 2027 to European customers, compared with 325 dollars in 2026. Aurubis has indicated an almost identical level, 347 $/t, up from the previous 315 $/t. The two proposals, separated by just three dollars, establish a demanding benchmark for buyers, but they are initial offers, not final prices already accepted by the entire market.
The distinction matters. The premium does not represent the copper quotation, but the amount added to the LME benchmark to obtain cathodes with specified characteristics and supply terms. Quality, origin, availability, transport and contractual terms can change its value. Consequently, industrial costs may rise even with a relatively stable LME price.
Mine Supply Shapes Expectations
Behind the refiners’ proposals lies a supply chain facing persistent pressure. The concentrates market is characterised by limited availability relative to the requirements of some smelters, with treatment and refining charges extremely compressed and sometimes negative in spot assessments. Mine operating difficulties and the time needed to develop new production capacity are fuelling concern about future supplies.
A shortage of concentrates, however, does not automatically mean an immediate shortage of cathodes in Europe. Between extraction and delivery of refined metal come inventories, processing capacity, shipments and commercial choices. The geographical distribution of flows also matters: arbitrage opportunities and expectations surrounding US tariffs may make it more attractive to direct some material to the American market, changing availability for European users.
The Gap Between Annual Contracts And The Spot Market
The European spot market presents a more nuanced picture. On 13 October, the premium for Grade A cathodes delivered in Germany stood at 270–300 $/t, up from 250–280 $/t on 6 October. For CIF Rotterdam material, the reference stood at 160–205 $/t, compared with 150–205 $/t a week earlier. The immediate market therefore shows some strengthening, but remains well below the annual offers for 2027.
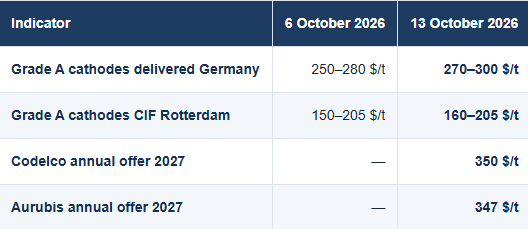
The gap is not a contradiction: an annual contract incorporates a supply commitment and an outlook for the whole year, whereas spot reflects conditions and availability at a particular moment. Moreover, CIF Rotterdam and delivery in Germany do not include the same logistics services. Comparing premiums without aligning location, quality, period, currency and delivery terms can easily lead to wrong conclusions.
Low-Emission Copper Follows A Specific Logic
Montanwerke Brixlegg has indicated 398 €/t for its low-emission cathodes in 2027, compared with 355 €/t in 2026. This premium cannot be compared directly with the dollar-denominated figures from major producers: beyond exchange rates, environmental certifications, material characteristics and sales conditions must be considered. As an additional indication, the European monthly reference for low-emission copper was 315–411 $/t as of 15 September, but it is not a universal price.
Implications For Purchasing Departments
For wire drawers, wire rod and cable manufacturers, electrical equipment companies and Italian processors, the issue is tangible. The total cost of a cathode depends on the LME price, the physical premium and other applicable terms, including the possible effect of the euro/dollar exchange rate. Companies selling at fixed prices while purchasing raw materials under variable conditions may see their margins narrow; indexation formulas and adjustment clauses can help manage part of that risk.
The decisive point for the 2027 budget is to establish which premiums will turn into actual contracts. A recovery in demand for cables and electricity grids could favour producers in negotiations; weak industrial consumption and cheaper spot alternatives would instead strengthen buyers’ positions.
BHP: Copper Output Falls, But Guidance Remains Unchanged
BHP produced 400,700 tonnes of copper between July and September 2026, 19% less year on year. The figure, relating to the first quarter of fiscal year 2027, reflects lower ore grades, maintenance, severe weather conditions and an operational disruption in Australia. The company nevertheless maintains annual guidance of 1.65–1.80 million tonnes. This is an important confirmation, although it calls for an acceleration in production over the following quarters.
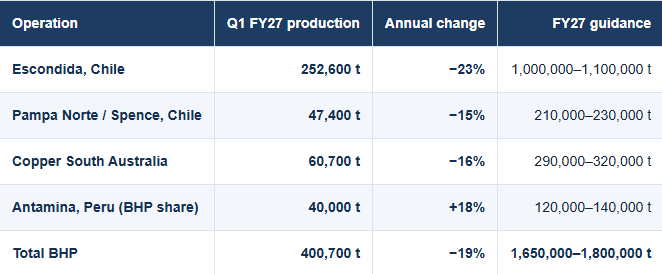
Data source: BHP communication dated 20 October 2026. For Antamina, production attributable to BHP is considered.
Escondida, The Main Issue
Escondida accounts for almost 63% of the group’s quarterly copper output and explains much of the slowdown. Production fell to 252,600 tonnes, while the average grade of ore fed to the concentrators declined from 0.94% to 0.81% compared with the corresponding period. In practical terms, more rock must be processed to obtain a similar amount of metal. Planned work and bad weather between July and August added to this structural challenge, affecting mine logistics.
On 23 September, a fatal accident also caused a temporary suspension of activities. Operations resumed gradually alongside safety checks. The subsequent preliminary agreement reached on 14 October with the supervisors’ union, covering a 36-month contract, reduced the risk of a strike without eliminating the site’s technical and geological problems.
Australia Recovering, Antamina Moving Against The Trend
In South Australia, the failure of the underground conveyor belt at Carrapateena affected a quarter that closed at 60,700 tonnes, 16% lower. BHP reported that replacement of the belt was completed in seven weeks and that the system returned to full conveying capacity after the progressive restart in September. This is a favourable sign for the operational recovery, but does not automatically ensure full recovery of lost volumes.
Antamina was the only major operation to grow, with 40,000 tonnes attributable to BHP, an increase of 18% thanks to higher planned grades and steady operations. Pampa Norte, on the other hand, recorded 47,400 tonnes, 15% less, amid ore variability and management of blends fed to the concentrator.
How Much Production Must Accelerate
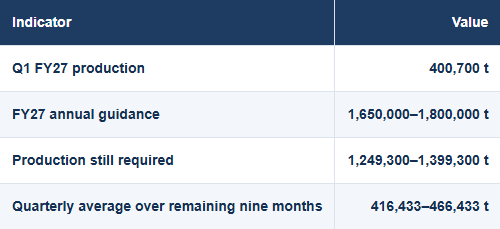
To reach its stated annual range, BHP must still produce between 1,249,300 and 1,399,300 tonnes over the following nine months. The required average pace is therefore between 416,433 and 466,433 tonnes per quarter, above the 400,700 tonnes just reported. This is a simple calculation based on guidance, not a new forecast announced by the group.
The Risk Extends Beyond A Single Group
The slowdown comes during a difficult period for Chile’s mining industry. According to the figures cited in the analysis, Chile’s national production fell by 7% in the first seven months of 2026, to 2.88 million tonnes. If major mines struggle to maintain volumes, the supply of concentrates to smelters also becomes more vulnerable. This does not necessarily cause an immediate shortage of refined copper, but it can change expectations concerning industrial costs and physical premiums.
BHP is meanwhile preparing future capacity. It has approved 800 million dollars of preliminary funding for a new concentrator at Escondida, earmarked for preparatory and design work. For Copper South Australia, it has also indicated potential output of around 500,000 tonnes per year by 2035 and up to 650,000 by 2040. These are long-term industrial horizons, not supplies that can offset today’s difficulties.
For buyers, the variable to watch is production continuity, alongside available inventories, concentrate market conditions and regional premiums. BHP’s next update will above all help establish whether the operational recovery is strong enough to support unchanged guidance.
LME Copper: A Symmetrical Triangle Opens A Conditional Bearish Scenario
After the recovery that began in spring and the summer ascent, three-month LME copper is going through a more fragile technical phase. September’s highs, in the 14,800–14,900 $/t area, have given way to more compressed fluctuations: lower highs and higher lows have drawn a symmetrical triangle, a pattern indicating a temporary loss of direction that can resolve either way.
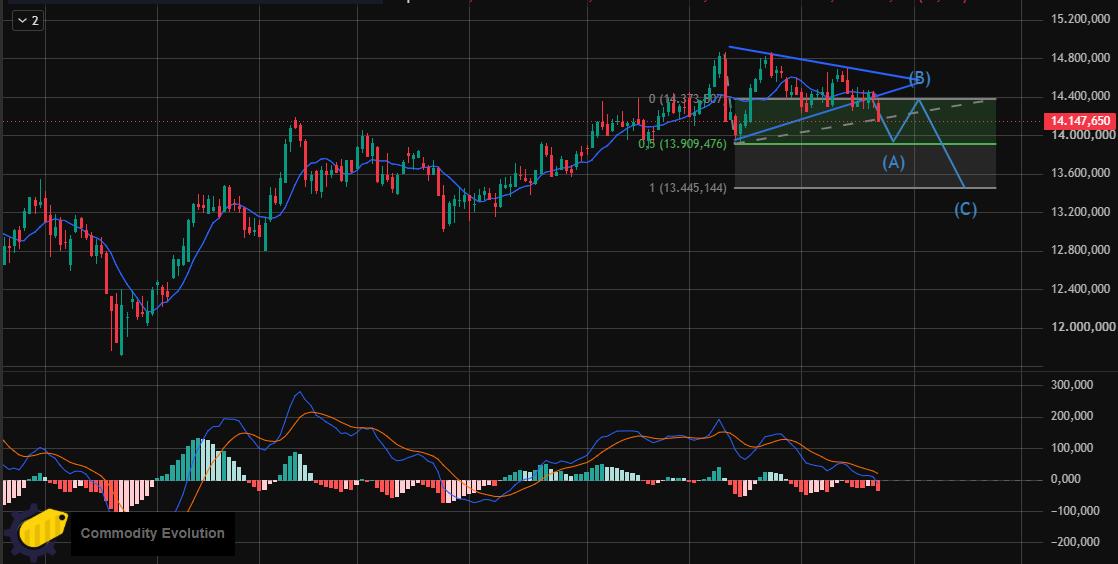
LME Copper – 3-month $/tonne, daily
On 22 October, the close observed on the chart was 14,190.70 $/t, with a daily change of −1.32%. The latest candles appear to have crossed the pattern’s ascending trendline to the downside. The breach deserves attention, but a marginal breakout is not enough to confirm a new trend, especially when the line’s exact position is visually estimated.
The Closes That Will Make The Difference
The 14,100–14,200 $/t band is the first test. Clearly lower daily closes, followed by a rejected attempt at recovery, would reinforce the bearish interpretation. A sustained move below 14,000 $/t would provide additional confirmation. Conversely, a recovery to 14,350–14,450 $/t and a return into the triangle would increase the risk of a false signal.
The pattern described is not a falling wedge: in a falling wedge both trendlines point downward; in a symmetrical triangle, resistance slopes downward while support slopes upward. This matters because, before the breakout, the pattern does not itself dictate a compulsory direction.
Price Targets And Time Horizon
The geometrical projection starts from the pattern’s initial height, visually estimated at 850–900 $/t between a high near 14,850 $/t and a base around 13,950–14,000 $/t. Subtracting that height from a hypothetical breakout point around 14,200–14,300 $/t gives a theoretical target in the 13,300–13,450 $/t area. This is an indicative range, not a prediction of a certain low.
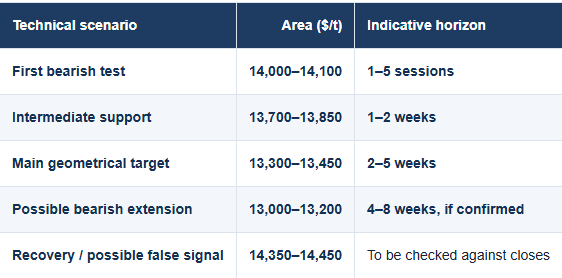
If confirmed, the movement could develop between late October and November 2026. These time windows are working assumptions: the triangle’s geometry permits an estimate of magnitude, not an exact deadline. Before reaching the deeper target, prices could pause at 14,000–14,100 $/t, rebound, or find support at 13,700–13,850 $/t.
The MACD And Alternative Scenarios
The MACD shows weakening momentum, with its lines close to zero and a slightly negative histogram. The indicator is consistent with fading impetus after the summer rally, but does not by itself certify a move to 13,300 $/t. Persistent indicator weakness together with price closes below the broken trendline would be more meaningful.
Three paths remain open. A confirmed breakout would place support at 14,000–14,100 and 13,700–13,850 $/t centre stage before the main projection. A rapid return above 14,350–14,450 $/t would weaken the signal and could take prices back towards 14,500–14,600 $/t and then September’s highs. Finally, prolonged sideways trading between 14,000 and 14,400 $/t would require the pattern to be updated rather than its original target being applied mechanically.
What Changes For Companies Buying Copper
A correction in the dollar-denominated future does not automatically translate into a saving of the same amount for a European buyer. Physical premiums, quotation periods, supply terms and the EUR/USD exchange rate may offset part of the LME decline. A procurement strategy should therefore assess the total cost in euros per tonne, not merely the price on a chart.
A decline towards support levels can become an opportunity to evaluate staggered purchases, hedges and indexation clauses, according to actual requirements. But indiscriminately postponing orders in the hope of a future low carries the opposite risk: copper may rapidly regain resistance levels. For late October and November, the signal remains bearish only conditionally, until closing prices confirm its validity.
The Takeaway For The Industrial Market
Copper currently displays a divergence that purchasing departments cannot ignore: while the LME chart suggests the possibility of a short-term correction, European premiums for 2027 are pointing higher and mining difficulties are a reminder of how complex expanding supply can be. None of these factors, in isolation, determines the final price.
The priority is to separate three risks: financial price, physical premium and exchange rate. Only a combined reading, integrated with inventories and company requirements, enables purchasing and budget planning without confusing a possible benchmark decline with a guaranteed improvement in supply conditions.
Commodity Evolution is the ideal solution to support the budgeting and negotiation activities of your corporate purchasing department.
Access to the platform allows you to view real-time prices and comprehensive market information for metals, steel, scrap, and many other sectors, with more than 1,500 products.
Request a Free Demo
Disclaimer
This document was prepared by Commodity Evolution. It is intended for consultation by those to whom it is addressed and, in any case, is not intended to replace the personal judgment of those to whom it is addressed. While Commodity Evolution has taken the utmost care in preparing this document and believes its contents to be reliable, it assumes no responsibility for the accuracy, completeness, or currency of the data and information contained therein or on the resources and data used to prepare it. Consequently, Commodity Evolution declines all liability for errors or omissions. The opinions, forecasts, or estimates contained in this document are expressed exclusively as of the date of this document’s preparation, and there is no guarantee that future results or any other future events will be consistent with the opinions, forecasts, or estimates contained herein. Any information contained in this document may be subject to changes or updates after the date of its preparation, without any obligation to communicate such changes or updates to those to whom this document has previously been distributed. This publication is provided to you for information and illustration purposes only and does not constitute a public offering of financial products or a promotion of investment services and/or activities, either to residents of Italy or to residents of other jurisdictions. Neither Commodity Evolution nor any of its directors, representatives, or employees assumes any liability, in whole or in part, for any damages (including, but not limited to, damages for loss of profits, business interruption, loss of information, or other economic losses of any nature) arising from the use, in any form and for any purpose, of the data and information contained in this document.