 Loading

The London Metal Exchange’s nonferrous metals market enters the final week of August with an increasingly selective and uneven picture. After a summer in which several metals shared a positive trend, recent sessions have revealed a growing divergence: zinc continues to strengthen and remains the sector’s leading asset, while aluminum, copper, tin, lead, and especially nickel are showing signs of greater weakness in the short term.
The distinction between performance expressed in dollars and those converted into euros is particularly interesting. Over the past month, the overall nonferrous metals index has remained unchanged in dollars but declined 2.78% in euros, indicating that currency movements have significantly attenuated, for European operators, some of the strength observed on international markets.
In this scenario, however, one metal is not only holding its ground, but accelerating: zinc, the central focus of this edition of the newsletter.
Zinc Dominates the Market in Dollars
Looking first at LME Cash prices expressed in dollars, the overall picture appears essentially neutral. The aggregate non-ferrous metals index stands at 3,200 points, unchanged over the last week, two weeks, three weeks, and the last month.
Behind this apparent stagnation, however, lie very different movements.
Zinc clearly represents the best performer of the group. With a Cash price of $3,980/t, the metal gained 2.71% in the last week, 5.15% in the last two, 7.26% in the last three, and most importantly, 9.55% over the course of a month.
This progression is particularly significant because it does not stem from a single sudden movement: the acceleration increases progressively as the time horizon broadens. The sequence of +2.71%, +5.15%, +7.26%, and +9.55% describes a structured upward trend, consistent with the tensions in concentrate supply, the strongly negative treatment charges, and the reduced metal availability that are characterizing the international zinc supply chain.
Following this trend are tin and copper, both still positive for the month but entering a consolidation phase.
Tin is trading at $55,900/t, maintaining a monthly gain of 4.98%, after a +2.27% gain over the three weeks. Recent trading sessions, however, show a clear slowdown: -0.36% over the two weeks and -0.31% in the last. The market therefore appears to have lost some of its previous upward momentum, without currently compromising the positive balance accumulated since the end of July.
A similar trend is emerging for copper, which remains at very high levels at $14,291/t. Monthly performance remains robust, at +4.95%, and three-week performance is +3.30%. However, the metal lost 1.75% in the last week, indicating that buyers are becoming more cautious after the previous advance.
Copper therefore remains structurally supported, but in the very short term it appears to be experiencing a phase of adjustment and profit-taking.
Aluminum Positive for the Month, But Without a Strong Direction
Aluminum is trading more sideways. At $3,227/t, the metal has maintained a 1.64% gain in the last month and a 0.97% gain over the three weeks, but has fallen 0.65% in the last week and 1.60% over the two weeks.
The picture suggests that the bullish momentum has not disappeared, but has rather weakened. After the tensions over physical supply that had characterized the previous months, the market appears to have temporarily found a zone of equilibrium.
The sustained positive monthly balance precludes any talk of a true reversal, but recent performance shows that aluminum, at least for now, lacks the same momentum as zinc.
Nickel and Lead Remain the Weak Links
The nickel picture appears more fragile, trading at $16,860/t. The metal recovered 1.72% in the last week and 0.69% over the two weeks, but these movements are not enough to erase the previous weakness: over the three weeks, the balance is still negative by 1.40% and for the entire month, it reaches -2.01%.
The recent recovery should therefore be interpreted primarily as an attempt to stabilize after a bearish phase, rather than as the confirmed start of a new positive trend.
Lead, at $1,857/t, also shows a relatively weak structure. The gains of 0.60% in the last week, 0.90% in the two weeks, and 0.30% in the three weeks are not enough to bring the monthly balance back into positive territory, still at -0.46%.
The market appears essentially sideways, lacking a catalyst strong enough to generate a convincing direction.
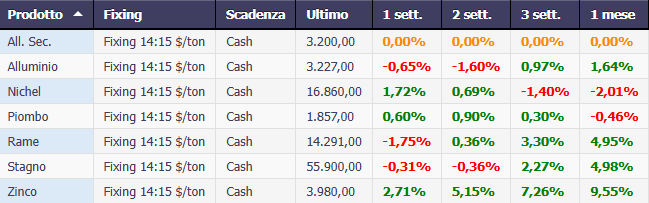
Performance Metals Cash $/ton
The Euro Downgrades Performance
The picture changes significantly when looking at LME Cash prices converted into euros.
The aggregate index fell to 2,735.14 points and recorded losses across all time horizons: -1.14% in the last week, -1.43% over the two-week period, -1.83% over the three-month period, and -2.78% over the last month.
The comparison with the dollar-denominated index, unchanged over all the same time periods, immediately highlights the impact of the currency component.
For a Eurozone user, therefore, the exchange rate has absorbed a significant portion of the gains recorded by raw materials in dollars, significantly altering the market perception and the actual cost of supplies.
The effect is clear for aluminum. In dollars, the metal gained 1.64% over the last month; expressed in euros, at €2,758.21/t, it recorded a decline of 1.19%. The two-week gap is equally significant: -1.60% in dollars versus -3.01% in euros.
The currency movement has thus transformed a modest positive monthly performance into a negative change for European buyers.
Nickel Amplifies Losses in Euros
Nickel, however, remains the most obvious case of weakness.
The cash price in euros stands at €14,410.75/t, and the monthly balance falls to -4.73%, versus -2.01% in dollars.
The three-week loss also reaches 3.20%, while the metal loses 0.76% over the two weeks. Only the last week returns slightly positive, with a +0.56%.
The reading therefore remains cautious: the most recent rebound is not yet sufficient to reverse a structure that, over the monthly horizon, remains the weakest of the entire LME basket analyzed.
Lead is also affected by the currency effect. At €1,587.23/t, it lost 3.23% over the past month, compared to the more modest -0.46% observed in dollars.
Copper and Tin Hold Up Even in Euros
The performance of copper and tin is more interesting, as both managed to maintain a positive monthly performance even after currency conversion.
Copper, at €12,214.95/t, has gained 2.03% over the past month and 1.42% over the three-week period. In the short term, however, the correction is clear: -1.08% over the two weeks and especially -2.87% in the last.
The difference compared to the +4.95% monthly gain in dollars shows how the exchange rate has reduced the rally for European operators, without however completely erasing it.
Tin, at €47,779.41/t, has maintained a monthly increase of 2.06% and a 0.40% increase over the three-week period. Here too, however, the latest readings show a loss of momentum, with -1.78% over the two weeks and -1.45% in the last.
Copper and tin are therefore in an intermediate position: the structure built over the last month remains positive, but the short-term signals a cooling phase.
Zinc Is the Only Metal to Strengthen Across All Time Frames
The most significant data of the entire comparison once again emerges from zinc.
At €3,401.83/t, the metal recorded +1.54% in the last week, +3.65% over the two, +5.31% over the three, and +6.50% over the last month.
Zinc is therefore not only the best metal in the basket in dollars, but also the only one to show positive and growing progress across all time frames, including in euros.
The comparison with the rest of the sector is clear. While the exchange rate turns aluminum’s monthly performance negative and amplifies nickel and lead losses, zinc maintains a 6.50% gain for European buyers.
Even more significant is the gap with the general index: over the past month, the non-ferrous metals basket has lost 2.78% in euros, while zinc has gained 6.50%. The performance spread therefore approaches 9.3 percentage points.
This isn’t simply a generalized movement in industrial commodities: zinc is developing its own momentum.
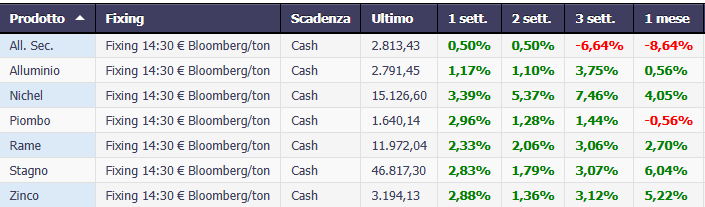
Performance Metals Cash €/ton Bloomberg
Zinc: Market Steady on the Surface, But Increasingly Tense on the Supply Side
The global zinc market is experiencing a seemingly contradictory phase. In Europe and the United States, spot activity remains weak, consumers are purchasing cautiously, and industrial demand continues to show little sign of acceleration. Yet, physical premiums remain high, and treatment charges on concentrates continue to decline into increasingly negative territory.
It is precisely this divergence that makes the market particularly interesting. Weak demand is not resulting in an excess of available metal. On the contrary, the supply chain continues to be affected by limited concentrate availability, high energy costs, logistical difficulties, and an LME curve structure that makes holding inventories costly.
The result is a market in which demand is not strong enough to generate a rally, but supply is not abundant enough to allow for a true correction in premiums.
United States: Premiums Stable and Market Waiting
In the United States, the zinc spot market maintained surprising stability during the first half of August. The premium for Special High Grade bars, with a minimum purity of 99.995% and delivery DDP in the Midwest, remained between 17 and 19 cents per pound, a range unchanged since July 7.
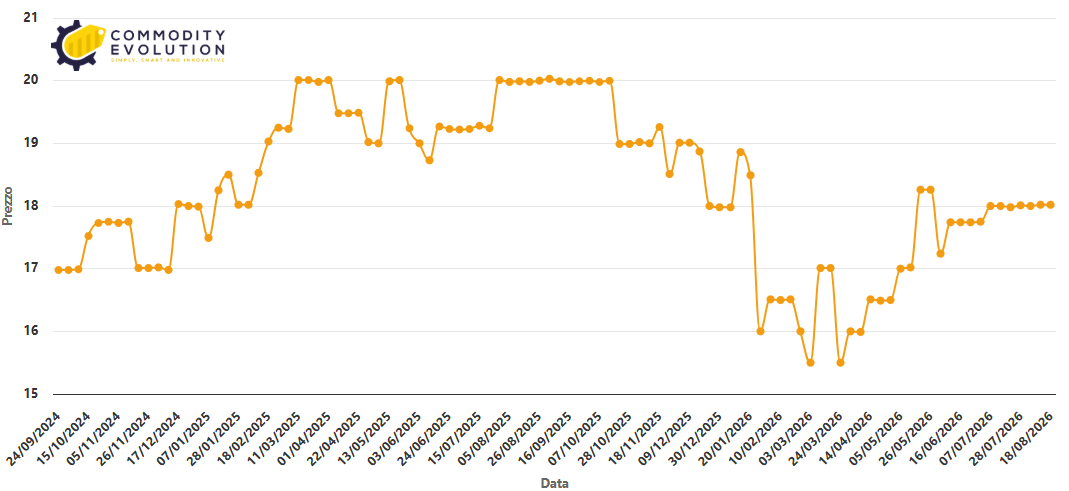
Premium Zinc SHG 99.995% DDP Bar – USA – Midwest $/lb – Powered by Commodity Evolution
The premium’s persistence at the same levels for over a month suggests a relatively mature balance between demand and physical supply.
However, this stability should not be confused with increased market activity: trading remains subdued, and buyers continue to primarily cover immediate needs.
Unlike copper, which is more exposed to uncertainties surrounding potential US tariffs and fluctuations in the CME-LME arbitrage market, zinc currently lacks an immediate catalyst capable of rapidly changing the premium.
The US calm therefore appears more structured: little upward pressure, but sufficient supply to prevent a significant downward movement.
Europe: Scarcity Overwhelms Weak Consumption
The zinc paradox emerges most clearly in Europe.
Industrial demand is weak, summer shutdowns have further reduced manufacturing activity, and no particularly liquid spot transactions have been reported in recent sessions. Despite this, premiums continue to hold.
Commodity Evolution valuations for SHG duty-paid zinc FCA Rotterdam and FCA Antwerp both remained at $300-330/t, while in Italy the FCA premium remained at $315-350/t and the DDP premium at $340-365/t.
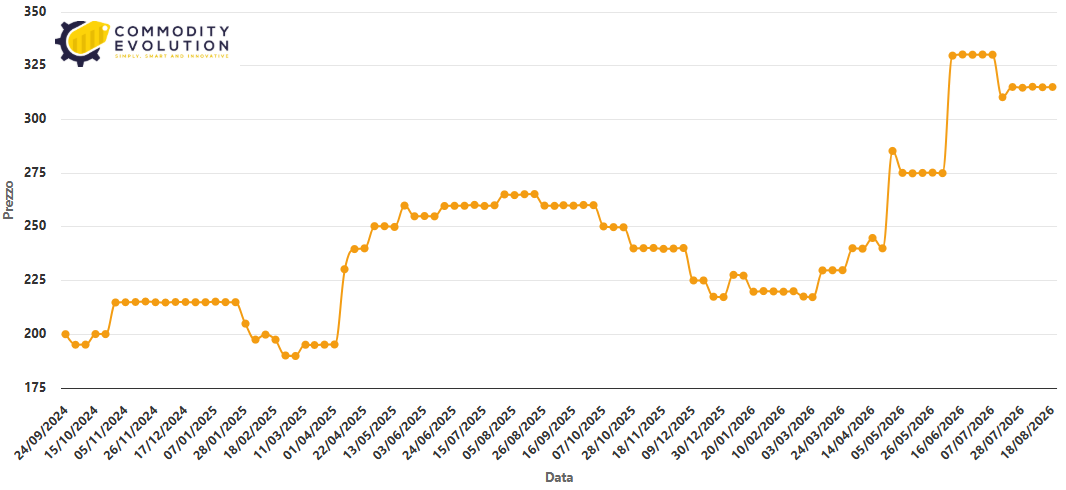
FCA High Purity Zinc Premium – Netherlands – Rotterdam $/ton – Powered by Commodity Evolution
The market message is clear: premiums remain high not because consumers are increasing orders, but because there is a lack of available metal to sell.
Many producers have reportedly reduced production and have limited quantities to allocate to the spot market. High electricity costs, logistical difficulties along some international routes and above all the shortage of concentrates are squeezing the supply of refined metal.
In this context, even modest demand is sufficient to prevent a significant drop in premiums.
Backwardation: Less Inventory And Even Less Liquidity
Further complicating the European picture is the structure of the LME curve.
Zinc’s cash-to-three-month spread showed a backwardation of around $71/t on August 18, essentially unchanged from the previous week.
In a backwardation setup, holding physical metal becomes expensive. The higher cash price compared to future deadlines penalizes those who purchase material to keep it in warehouse, because the financial and logistical cost is added to the cost linked to the renewal of coverage.
For this reason, many traders are avoiding building new inventories and only purchasing the material necessary to fulfill already confirmed orders.
The consequence is apparently paradoxical: backwardation reduces the interest in accumulating inventory, but this very behavior further limits the metal immediately available and helps to support premiums.
The market therefore remains illiquid not only due to the weakness of demand, but also because few operators are willing to assume the cost of maintaining physical positions.
Negative Treatment Charges: The True Sign of Scarcity
The strongest signal of tensions in the supply chain comes from the concentrates market.
Spot treatment charges for CIF China zinc concentrates fell to -90/-130 $/t, compared to the previous range of -80/-120 $/t.
These are exceptionally low levels. Under normal conditions, a smelter receives compensation from the mine producer for turning the concentrate into refined metal. When TCs become negative, the economic relationship is reversed: it is the foundries that have to recognize increasingly favorable conditions for mineral producers in order to secure the raw material.
This means that the melting capacity available is greater than the amount of concentrate readily available.
Global zinc mining production fell 0.9% between January and May 2026 compared to the same period in 2025, while refining capacity remains high. The result is growing competition between smelters for concentrate availability that is not growing at the same rate.
China: Concentrates Scarce But Imports Not Convenient
China represents the point where this tension becomes even more evident.
Despite the highly negative TCs, Chinese smelters are not indiscriminately increasing purchases of foreign concentrates. The market is mainly held back by import arbitrage, which remains extremely unfavourable.
On August 14, the Commodity Evolution calculation indicated a loss of approximately $642.93/t on zinc imports.
In other words, buying concentrate abroad, transporting it to China and transforming it into refined metal continues to be economically uneconomical compared to using domestic raw material.
For this reason, foundries are becoming very selective. Standard concentrates without by-products find little liquidity, while cargoes rich in copper, silver, gold or other recoverable metals are also purchased at particularly negative TCs, because the ancillary revenues allow them to partially compensate for the loss on zinc processing.
The market is therefore not simply rewarding the availability of concentrate, but the overall economic quality of the load.
Byproducts Become a Key Part of Margin
In a period of negative TC, smelters’ profitability is increasingly less dependent on zinc alone.
Cargoes containing secondary metals can offer significant additional value. During processing, smelters can recover copper, silver, gold, and other elements and monetize them separately.
Some recent deals involving byproduct-rich concentrates have been concluded with TCs between -$110 and -$120/t, while for standard materials, activity has been concentrated around -$100/t.
The price of sulfuric acid also plays an important role. The acid is produced during the processing of sulfur concentrates and represents an ancillary source of revenue for many smelters. The recent weakening of its price in China has further reduced the capacity of smelters to absorb negative TCs.
In such a tight market, every component of the industrial margin becomes crucial.
Foundries Already Looking to Winter
Despite weak spot purchases, some Chinese foundries have already begun covering part of their requirements for the fourth quarter and early next year.
There have been reports of future deals being concluded on even more aggressive terms than spot levels, a sign that some operators prefer to accept significantly negative TCs today rather than risk a raw material shortage during the winter.
The logic is defensive. A smelter that cannot procure sufficient concentrate may be forced to reduce utilization rates, with operating costs potentially exceeding the loss resulting from a poorly profitable contract.
This dynamic could become particularly important in the coming months. If multiple smelters simultaneously begin restocking winter stocks, competition for available cargoes could intensify further.
Mines Maintain Control of Negotiations
Bargaining power remains firmly in the hands of the mining producers.
Some international tenders have been awarded with treatment charges between -$130 and -$150/t, levels even more aggressive than the Chinese spot market.
Among the affected origins are cargoes from the Century mine in Australia and Bunavistia in Mexico.
The mines’ ability to place material at these conditions confirms that the shortage is not merely perceived: the qualified concentrate available on the international market is insufficient to meet the needs of global smelting capacity.
Until mine supply shows a more evident recovery, it will be difficult to see a significant normalization of TC prices.
Chinese Imports: Refined Zinc Collapses, Concentrates Hold Up
Chinese customs data for July adds another important piece to the puzzle.
Refined zinc imports fell to just 5,130 tonnes, a 71.3% decrease compared to July 2025. In the first seven months of the year, purchases reached 64,723 tonnes, a 69.2% decrease year-over-year.
This is one of the deepest declines among all nonferrous metals analyzed.
Concentrate imports performed differently. Imports of zinc ore and concentrate reached 425,600 tonnes in July, a 17.3% increase compared to June. In the first seven months, cumulative volumes grew 4.8% year-over-year.
The contrast is significant: China is importing significantly less refined metal, but continues to maintain a high level of raw material supplies for domestic processing.
This confirms the centrality of domestic smelters in China’s procurement strategy, even if the profitability of concentrate imports remains extremely limited.
China Is Changing the Composition of Its Imports
Zinc’s behavior is part of a broader trend observed in Chinese customs data.
Beijing is progressively changing the composition of its imports: in several markets, purchases of refined metal are decreasing, while the proportion of minerals, concentrates, and raw materials for domestic processing is increasing or remaining high.
In copper, scrap is increasing while refined metal is decreasing; in nickel, ore purchases are increasing while numerous intermediate products are declining; in zinc, the phenomenon is even more evident.
This strategy may allow China to maintain greater control over the industrial processing phase and the added value of the supply chain, but at the same time, it increases its dependence on the global availability of raw materials.
In the case of zinc, this very availability represents the main point of tension today.
Northern and Southern Europe Ever Closer
Another interesting change concerns the progressive narrowing of the gap between zinc premiums in Northern and Southern Europe.
Historically, the Italian market tended to have significantly higher premiums than Rotterdam and Antwerp, partly due to a smaller variety of brands and origins available.
In recent months, however, scarcity in Northern Europe has increased the value of the few units on the market, while weak Italian demand has limited the ability of Southern European sellers to maintain very wide differentials.
The gap between the two areas has thus narrowed to a few dozen dollars per ton.
This process suggests that scarcity is becoming increasingly uniform across the European market, reducing traditional regional differences.
A Weak, But Not Abundant Market
Zinc is therefore in an unusual situation.
European demand is weak. The Italian market is virtually at a standstill. American operators continue to move cautiously. In China, refined metal imports have collapsed, and arbitrage is making many foreign concentrate purchases unprofitable.
Yet the market is not showing the typical signs of a period of abundance.
Physical premiums remain high, backwardation discourages inventory building, TCs are deeply negative, and mines maintain strong negotiating power.
Weak demand and tight supply are therefore coexisting.
This is the main characteristic of the zinc market in summer 2026.
Outlook: The Fourth Quarter Will Be the Real Test
The transition from summer to the fourth quarter will be the decisive moment.
If European industrial production returns to growth after the seasonal shutdowns and if Chinese smelters step up their winter stockpiling, the market could quickly come under greater pressure.
With concentrate availability still limited, even a moderate recovery in demand could be enough to strengthen premiums and keep treatment charges at extremely negative levels.
Conversely, continued weak demand could limit the transmission of mineral shortages to refined metal prices, leaving the market in a situation similar to the current one: low liquidity, little metal, and surprisingly resilient physical prices.
For now, the most important signal comes from upstream.
Zinc isn’t facing a demand crisis, but it’s not an abundant market either. It’s going through a phase in which raw material scarcity is strong enough to support premiums, but not yet accompanied by sufficient consumption to generate a true rally.
And it is precisely this fragile balance between a pressured mining supply chain and uncertain final demand that will determine the market’s direction in the coming months.
LME Zinc: September Opens with a Still Bullish Trend
The three-month LME zinc price enters September 2026 in a strong position. After experiencing a much more erratic phase between April and July, the metal accelerated during August, returning to the $3,800/t area, the highest level of the period observed.
The last session visible on the chart shows a close around $3,800/t, following a high above $3,808/t. The most interesting data, however, is not only the level reached, but the market structure with which it arrived there: since the March correction, the price has progressively built higher lows and higher highs, with each period of weakness absorbed at higher levels than the previous one.
The configuration therefore remains bullish, although the entry into the $3,800/t area brings the market to a significant technical transition. September will demonstrate whether zinc still has the strength to transform the summer rally into a new upward trend or whether, after the August acceleration, a consolidation phase will be necessary.
August Changed the Market’s Pace
The first part of the summer was characterized by relatively sideways movement, with zinc mostly confined between $3,450 and $3,600/t. Since the end of July, however, price behavior has changed.
The breakout of the $3,600/t area initiated an acceleration phase that quickly pushed the contract toward $3,700-$3,750/t, transforming what until a few weeks earlier had been a resistance band into a new support zone.
The corrections observed during August were also quickly reabsorbed. This behavior signals that buying pressure remains present and that pullbacks are still being used to rebuild positions, rather than triggering a true distribution phase.
The return above $3,750/t and the subsequent attack on $3,800/t therefore reinforce the reading of a market which, for the moment, maintains a positive structure.
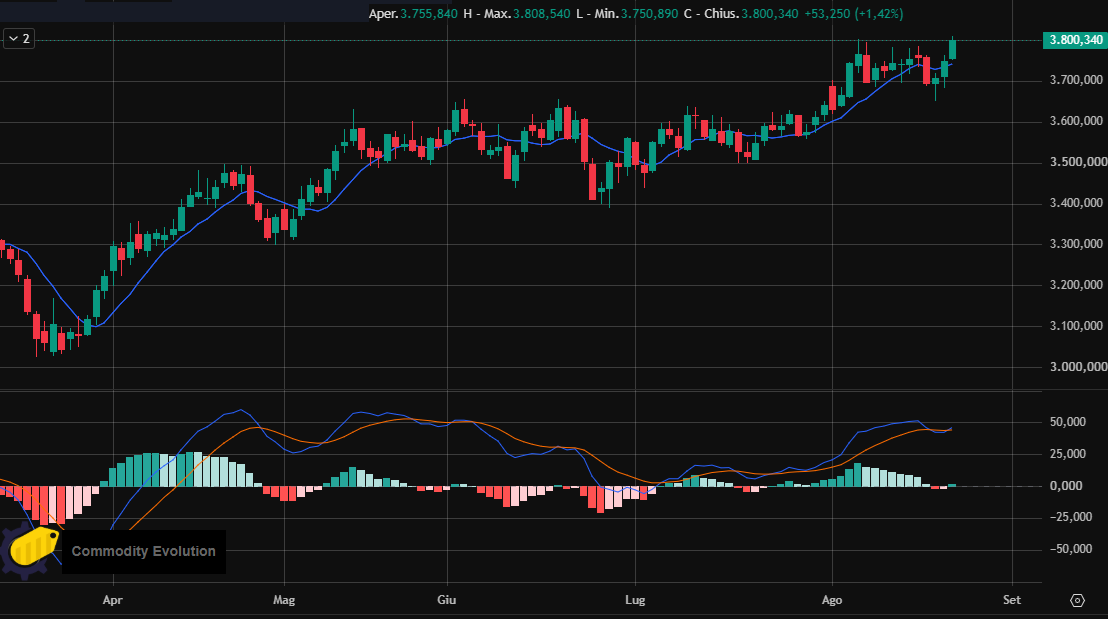
Zinc LME 3M $/ton – Powered by Commodity Evolution
Momentum Remains Positive, But Acceleration Is Slowing
The momentum indicator at the bottom of the chart, however, adds an important nuance.
The bullish movement that began between late July and early August was accompanied by a marked improvement in the indicator, with a return to positive territory and a progressive broadening of the bullish component.
In recent sessions, however, the distance between the two momentum lines has narrowed, and the histogram has returned to near zero.
This is not yet a bearish signal, but it suggests that the speed of the movement is slowing just as the price is testing the highs.
This makes the $3,800-$3,820/t area particularly important: a breakout accompanied by a renewed acceleration in momentum would significantly strengthen the bullish scenario; conversely, repeated failures at these levels could trigger a consolidation phase.
The $3,800 Threshold Becomes the First Test of September
The current level represents the first real resistance to monitor.
The market is attempting to stabilize above $3,800/t, but to turn this movement into a convincing breakout, repeated closes above the $3,800-$3,820/t area will be needed.
If this were to occur, the chart would leave relatively little technical room before the next psychological threshold.
The first target would become $3,900/t, while an extension of the movement could take zinc towards $3,950-$4,000/t.
The $4,000/t threshold would naturally represent a much more challenging level, both technically and psychologically. Reaching it during September would likely require a further deterioration in supply conditions or a more decisive return to buying after the summer break.
Price Target for September 2026
Baseline scenario: $3,650-$3,900/t, with a predominantly consolidation phase at the top of the range and attempts to break the August highs.
September Will Be the Test of Scarcity and Demand
Zinc is therefore entering September with a significantly stronger profile than at the beginning of the summer.
The price has reached new highs, the technical structure remains bullish, and above all, tensions upstream in the supply chain continue to offer fundamental support that is difficult to ignore.
However, one major unknown remains: demand.
So far, the rally has occurred amid still-weak European consumption and an extremely selective Chinese market. This means that much of zinc’s strength continues to depend on scarcity rather than a true acceleration of the industrial cycle.
And it is precisely this element that makes September particularly interesting.
If the resumption of activity after the summer break were to encounter a supply chain still characterized by scarce concentrates, deeply negative treatment charges, and low levels of physical availability, the market could have the conditions to attempt the $4,000/t area.
If, however, demand continues to disappoint, the current slowdown in momentum could translate into a consolidation phase toward $3,700-$3,650/t.
For now, therefore, the bias remains bullish, but September will have to confirm that there is enough demand behind the summer rally to transform the raw material shortage into a new price advance.
Commodity Evolution is the ideal solution to support the budgeting and negotiation activities of your corporate purchasing department.
Access to the platform allows you to view real-time prices and comprehensive market information for metals, steel, scrap, and many other sectors, with more than 1,500 products.
Request a Free Demo
Disclaimer
This document was prepared by Commodity Evolution. It is intended for consultation by those to whom it is addressed and, in any case, is not intended to replace the personal judgment of those to whom it is addressed. While Commodity Evolution has taken the utmost care in preparing this document and believes its contents to be reliable, it assumes no responsibility for the accuracy, completeness, or currency of the data and information contained therein or on the resources and data used to prepare it. Consequently, Commodity Evolution declines all liability for errors or omissions. The opinions, forecasts, or estimates contained in this document are expressed exclusively as of the date of this document’s preparation, and there is no guarantee that future results or any other future events will be consistent with the opinions, forecasts, or estimates contained herein. Any information contained in this document may be subject to changes or updates after the date of its preparation, without any obligation to communicate such changes or updates to those to whom this document has previously been distributed. This publication is provided to you for information and illustration purposes only and does not constitute a public offering of financial products or a promotion of investment services and/or activities, either to residents of Italy or to residents of other jurisdictions. Neither Commodity Evolution nor any of its directors, representatives, or employees assumes any liability, in whole or in part, for any damages (including, but not limited to, damages for loss of profits, business interruption, loss of information, or other economic losses of any nature) arising from the use, in any form and for any purpose, of the data and information contained in this document.