 Loading
 The last month of the non-ferrous metals market confirmed an overall positive picture, with widespread monthly performances in bullish territory in both dollars ($/ton) and euros (€/ton), and some particularly significant movements reflecting specific dynamics of supply, demand, and sentiment.
Tin clearly stands out, confirming its position as the undisputed star of the period: prices performed far above the basket average, jumping over 6% in dollars and an exceptional 7.4% in euros on a monthly basis. This momentum aligns with strong structural tension in the market, where limited supply and technological demand continue to support high price levels.
Copper also recorded a robust performance, further consolidating its position as the benchmark metal for global industrial activity. In dollars, copper rose 0.52%, while in euros it remained positive with over 1.5% on a monthly basis. The indication is that the market, despite experiencing a period of cyclical consolidation, is not losing fundamental momentum.
Aluminum is showing an equally positive trend, with gains in both dollars and euros, reaching increases of more than +2.50% in euros and with similar dynamics in dollar terms. This result reflects stronger demand and a global supply that, while still generous, is progressively more balanced.
Nickel also showed positive signs, closing the month with solid performances in both currencies (+1.8% in euros and over +0.8% in dollars), confirming a moderate recovery after the volatility that characterized the previous months. Lead, despite more limited variations, showed a decline of -1.48% in dollars, while in euros it showed a small decline on a monthly basis.
Finally, zinc remained stable, with slight variations in both dollars and euros. The metal reflects a balanced market, where demand is not showing sufficient pressure to generate significant directional movements, but remains capable of sustaining current levels.
Overall, this month’s outlook confirms positive sentiment for non-ferrous metals, with underlying trends remaining constructive on several fronts. In particular, tin and copper stand out for their relative strength, while aluminum and nickel support a broader, more dynamic market picture. Price behavior suggests a global economy that, despite some cyclical uncertainties, continues to generate demand for strategic raw materials.
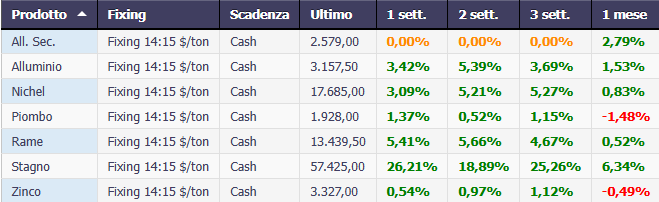
Performance Metals Cash $/ton
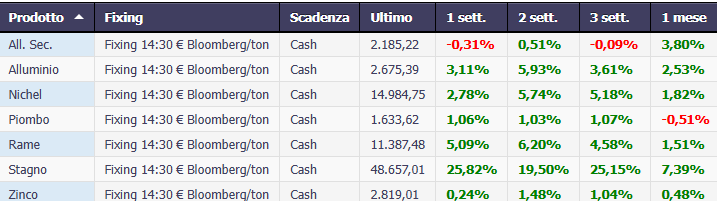
Performance Metals Cash €/ton Bloomberg
Tin: Structural Rally or Speculative Excess?
The tin market has experienced one of the most intense and spectacular phases of all LME nonferrous metals in recent months. The rally that brought prices to historically high levels was not a simple technical movement, but the result of a complex interplay of solid fundamentals, structural supply tensions, and an increasingly active financial component.
The primary key to understanding the market remains the very nature of the tin market: a small, concentrated, and vulnerable sector. Unlike copper or aluminum, tin does not have a broad and diversified production base.
Global supply is highly concentrated in a few countries—particularly Indonesia, Myanmar, and China—and largely depends on small-scale mines or semi-artisanal operations, often subject to operational disruptions, environmental restrictions, or regulatory instability. This makes the market inherently fragile.
In recent quarters, the availability of concentrates and refined metal has shown signs of tightness. Delays in mining projects, infrastructure constraints, and energy difficulties in some production areas have compressed supply growth even as industrial demand remained resilient. The result has been an increasingly tense equilibrium, in which even marginal changes in physical flows have had an amplified impact on prices.
On the demand side, tin continues to benefit from a powerful structural driver: electronics. As a critical component in solder alloys, the metal is directly exposed to the expansion of semiconductors, data centers, artificial intelligence, electric vehicles, and renewable infrastructure.
Even in a less than perfectly linear macroeconomic environment, these segments maintain a growth trajectory that supports global tin consumption.
However, the recent price movement cannot be explained by industrial fundamentals alone. The rally has attracted financial capital and speculative interest, amplifying volatility. Futures markets—both LME and Asian—have shown dynamics in which momentum has played a decisive role, with positioning pushing prices beyond levels justified by immediate physical flows. In a relatively small market, the entry of financial volumes can generate rapid and sharp fluctuations.
This does not mean that the rally is without real basis. On the contrary, the speculative component has arisen in an already structurally tense environment. The real question for 2026 is not whether the market is “too high,” but whether supply will be able to grow enough to avoid a deficit.
Current projections indicate that global production could increase, but at a slower pace than expected demand. If this scenario materializes, the market would remain exposed to new episodes of tension.
Another factor to consider is the impact on producers. High prices improve mining companies’ margins and incentivize investment, but the nature of tin projects—often complex and with long development times—means that additional supply cannot materialize quickly. This creates a structural lag between price signals and production responses.
In short, tin is in a phase where fundamentals and finances are mutually reinforcing. Structural demand offers medium-term support, while supply tightness amplifies any imbalances. At the same time, the presence of speculative capital increases the likelihood of sharp movements, both upward and in potential corrective phases.
The key question for the coming months will be whether the market is experiencing a technical adjustment phase after an excessive rally, or whether it is preparing for a new surge linked to a real metal deficit.
LME Tin: Violent Rally, Intermediate Correction, and New Acceleration
The 3-month LME tin chart tells a clear story: the market shifted gears starting in December, transforming a sideways phase into a decisive and progressive uptrend. After months of moderate fluctuations between $34,000 and $38,000/t, prices established a sequence of higher lows, accelerating strongly between January and February 2026.
The momentum led tin to first surpass the $45,000/t area, then $50,000/t, until it reached the psychological threshold of $55,000–$56,000/t, a level that coincides with the recent highs highlighted on the chart.
The key issue for the coming months will be whether the market is experiencing a technical adjustment phase after an excessive rally, or whether it is preparing for a new surge linked to a real deficit of the metal.
LME Tin: Violent Rally, Intermediate Correction, and New Acceleration
The 3-month LME tin chart tells a clear story: the market shifted gears starting in December, transforming a sideways phase into a decisive and progressive uptrend. After months of moderate fluctuations between $34,000 and $38,000/t, prices established a sequence of higher lows, accelerating strongly between January and February 2026.
The momentum led tin to first surpass the $45,000/t area, then $50,000/t, until it reached the psychological threshold of $55,000–$56,000/t, a level that coincides with the recent highs highlighted on the chart.
The technical structure is typical of markets with low liquidity and a strong speculative component: rapid movements, large candlesticks, heightened volatility, and equally rapid retracements. After the initial peak in January, the market underwent a significant correction to the $45,000–$46,000/t range, but without compromising the underlying bullish structure. The subsequent recovery brought prices back to their highs.
This behavior indicates that the market isn’t simply euphoric: each phase of correction is absorbed, a sign of demand—both physical and financial—still present on the downside.
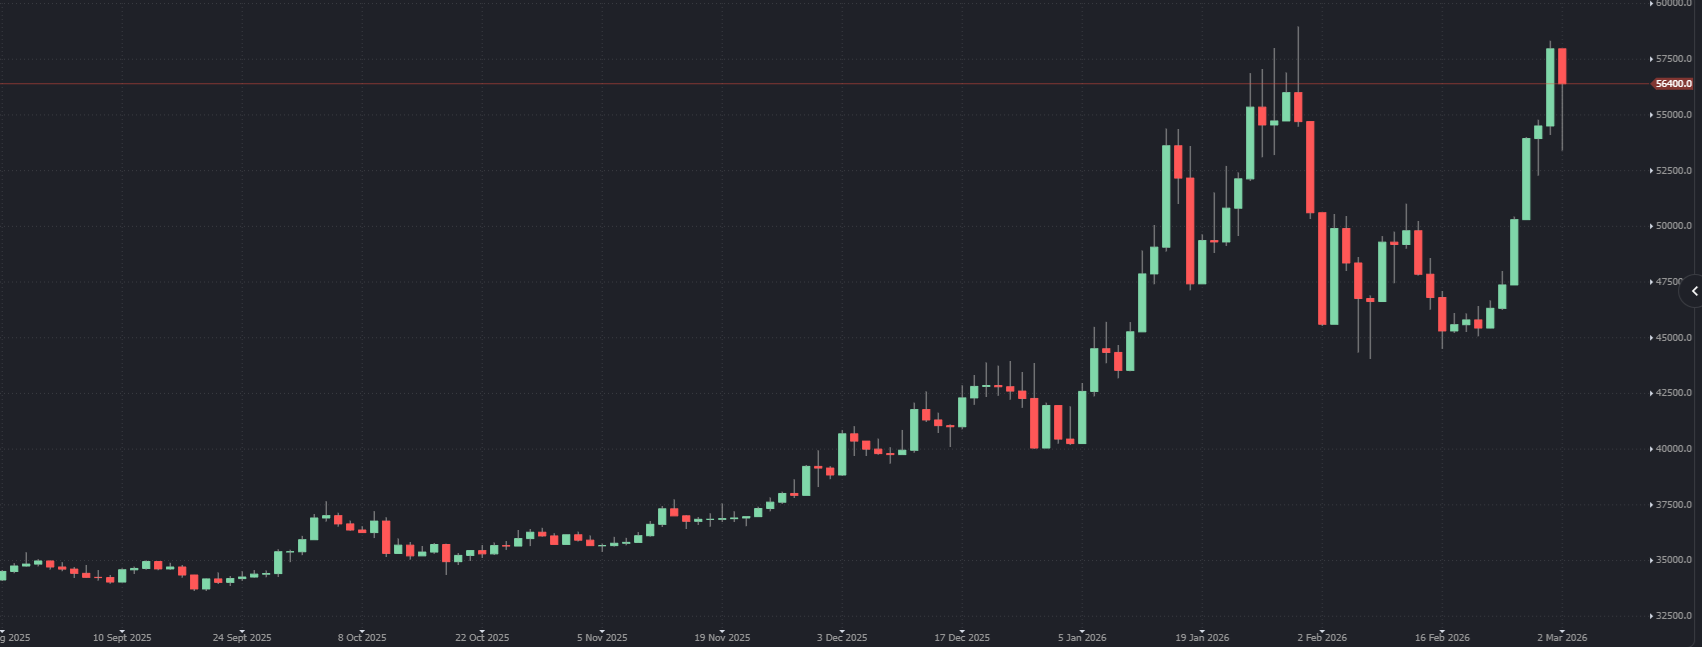
LME Tin – 3 month $/ton daily
Key Technical Levels for March 2026
Based on the chart, March opens with three key areas:
Primary resistance: $56,000–$58,000/t
This is the recent high and psychological barrier. A clear break above $58,000/t would open room for a technical extension to the $60,000–$62,000/t area, with potentially accelerated momentum.
Intermediate support: $50,000–$51,000/t
Previous consolidation area and the trend’s first defense level. A drop below this level would increase volatility but would not immediately invalidate the bullish structure.
Structural support: $45,000–$46,000/t
This is a key level that has already served as a starting point. Only a break of this area would transform the move into a deeper correction.
Probable Scenario for March
March looks set to be a month of high volatility, but with a still constructive bias.
The market is in a phase in which:
- fundamentals support high prices (supply tightness);
- the financial component amplifies every movement;
- structural demand for electronics remains intact.
The most likely scenario is a consolidation phase above $50,000/t, with tentative tests of the $56,000–$58,000/t area. An upside breakout cannot be ruled out, but would require new supply catalysts or a further intensification of speculative buying.
At the same time, volatility suggests that sudden retracements toward $50,000/t are natural and may represent phases of rebalancing, not necessarily reversals.
Tin Price Target – March 2026
Expected Range: $50,000 – $58,000/t
Extended Bullish Target (Breakout): $60,000 – $62,000/t
Deep Corrective Scenario (Less Likely): Return to $45,000/t
Market Bias: Bullish but Extremely Volatile
Tin enters March as the most dynamic and speculatively sensitive metal in the LME basket. The trend is strong, but the speed of the movement warrants caution. It’s a market that runs, stops abruptly, corrects, and restarts with the same intensity.
As long as the $50,000/t area holds, the dominant narrative will remain that of a structurally tense market, more prone to further accelerations than a definitive reversal.
LME Tin in Euros: Rally Confirmed, New Highs, and Relative Strength
The euro-denominated tin chart shows equally powerful momentum compared to the dollar version, but with an interesting twist: the progression appears even more linear in the final phase, with February closing at the all-time highs of the period observed, in the €48,000–€49,000/t range.
After the autumnal sideways phase between €30,000 and €33,000/t, the market built a gradual climb until December, then accelerated sharply between January and February. The intermediate correction seen in the first half of February—with a return to the €38,000–€40,000/t range—was decisively reabsorbed, a sign that demand (or speculative pressure) remained active even in the European currency.
The final push toward the end of the month led prices to retest the highs, with a near-vertical acceleration in the final days of February. This behavior indicates that, for now, the bullish structure is not yet exhausted.
Key Technical Levels in Euro
Primary Resistance: €48,500–€50,000/t
This is the new high. A stable break above €50,000/t would open technical room towards €52,000–€54,000/t, a level consistent with the extension in US dollars towards $60,000/t.
Intermediate Support: €43,000–€44,000/t
Previous consolidation area and the first defense level of the trend. A return here would be natural in the event of profit-taking.
Structural Support: €38,000–€40,000/t
This area has already been tested and forcefully rejected. Only a drop below this level would alter the medium-term bullish structure.
Dollar vs. Euro: No Structural Divergence
No significant divergences emerge between the two currencies. The rally is consistent in both the $ and €, indicating that the movement is driven by the metal market and not by a currency effect. This reinforces the view that it is driven by real, rather than purely currency, momentum.
Scenario – March 2026
Tin enters March (February having just ended) with:
- primary bullish trend;
- high volatility;
- highs being tested;
- structurally tense fundamentals.
The market appears to be in a phase of impulsive expansion, typical of low-liquidity metals when real or perceived shortages are triggered. The main risk is not so much a reversal, but a violent but temporary technical correction, typical of this type of market.
Tin Forecast March 2026
In Dollars ($/t)
Expected Range: 50,000 – 58,000
Bullish Breakout: 60,000 – 62,000
Key Support: 50,000
Structural Support: 45,000
In Euro (€/t)
Expected Range: 43,000 – 49,000
Bullish Breakout: 52,000 – 54,000
Key Support: 43,000
Structural Support: 38,000
Bias: Bullish with very high volatility.
Tin remains the most dynamic metal in the LME basket. It is not a market for those seeking stability, but it is the metal that best reflects what happens when structural demand and supply rigidity meet in a reactive financial environment.
As long as these supports hold, the dominant narrative will remain that of a tense market, ripe for further acceleration rather than a structural reversal.
Commodity Evolution is the ideal solution to support the budgeting and negotiation activities of your corporate purchasing department.
Access to the platform allows you to view real-time prices and comprehensive market information for metals, steel, scrap, and many other sectors, with more than 1,500 products.
Request a Free Demo
Disclaimer
This document was prepared by Commodity Evolution. It is intended for consultation by those to whom it is addressed and, in any case, is not intended to replace the personal judgment of those to whom it is addressed. While Commodity Evolution has taken the utmost care in preparing this document and believes its contents to be reliable, it assumes no responsibility for the accuracy, completeness, or currency of the data and information contained therein or on the resources and data used to prepare it. Consequently, Commodity Evolution declines all liability for errors or omissions. The opinions, forecasts, or estimates contained in this document are expressed exclusively as of the date of this document’s preparation, and there is no guarantee that future results or any other future events will be consistent with the opinions, forecasts, or estimates contained herein. Any information contained in this document may be subject to changes or updates after the date of its preparation, without any obligation to communicate such changes or updates to those to whom this document has previously been distributed. This publication is provided to you for information and illustration purposes only and does not constitute a public offering of financial products or a promotion of investment services and/or activities, either to residents of Italy or to residents of other jurisdictions. Neither Commodity Evolution nor any of its directors, representatives, or employees assumes any liability, in whole or in part, for any damages (including, but not limited to, damages for loss of profits, business interruption, loss of information, or other economic losses of any nature) arising from the use, in any form and for any purpose, of the data and information contained in this document.