 Loading
 After the decidedly negative phase of the last few months, triggered between July and October, depending on the reference metal, there have been first signs of recovery, widely predicted on Oct. 26 by our study office (link here). Another useful tool for forecasting purposes, combined with other systems is the so-called C.O.T. report (COTR). The Commitments of Traders Report is a report published weekly by the London Stock Exchange (LME) and summarizes all positions (both buying and selling) held by different classes of investors.
The main classes of investors are:
- SPECULATOR
- Investment Firms/Credit institutions (Investment Firms/Credit institutions);
- Investment Funds (Investment Funds) – undertaking for collective investment in transferable securities (UCITS) or an alternative investment fund manager;
- Other Financial Institutions (Other Financial Institutions) – including insurance companies and reinsurance companies and occupational pension institutions.
- COMMERCIAL
-
- These are traders (firms) that hedge against price fluctuations primarily through futures markets. They are often referred to as hedgers. The action of commercials is strictly hedging. For example, if a commercial turns up for sale, it means that it currently owns the actual commodity and is hedging against the risk of price declines.
Thus, the Commitments of Traders report is not suitable for those who need short-term information but rather is to be applied to a long-term strategy.
Let us now go on to analyze the data for each individual metal and its potential effect:
- Speculators – % var in buying: % change in long positions (in buying);
- Speculators – % var on selling: % change in short (selling) positions;
- Speculators – Net positions: monthly absolute difference between long (buying) and short (selling) positions. The result if positive, will indicate that the main classes of investors will be in an overall buy position on the instrument in question while if negative will show that investors will be in an overall sell position;
- C.o.t Index – the indicator, expressed on a percentage basis from 0 to 100, reflects net positions based on the latest available data. It can be used as an “overbought” and “oversold” indicator, and used in parallel with one’s own studies and analysis it turns out to be a good tool for understanding where investors are moving. If the C.O.T. Index turns out to be close to 100% (overbought) it means that speculative forces are in strong buying but this phase may not last for long. Near 0% the opposite is true.
ALUMINUM

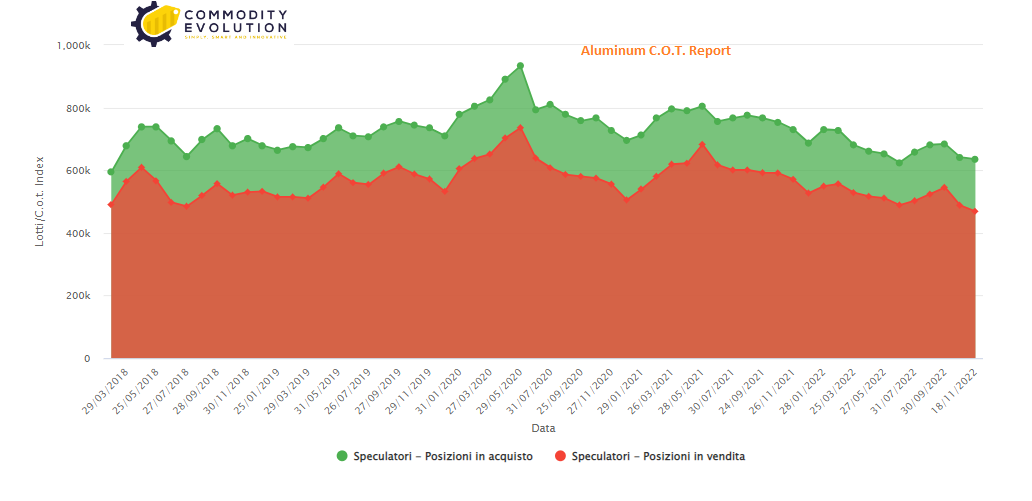
It can be seen that speculator long positions have decreased from the end of October to Nov. 18 (latest available data) by 0.97 percent while short positions have fallen the most (by -3.88 percent). As a result, net positions have risen 12,742 lots, to 166,687 lots, with the Cot index firmly recovering from mid-year lows. Given the trend, a resumption of buying speculators would not be shocking, with a return toward the highs of net positions at 202,000 lots.
Price projection: Fairly positive
COPPER

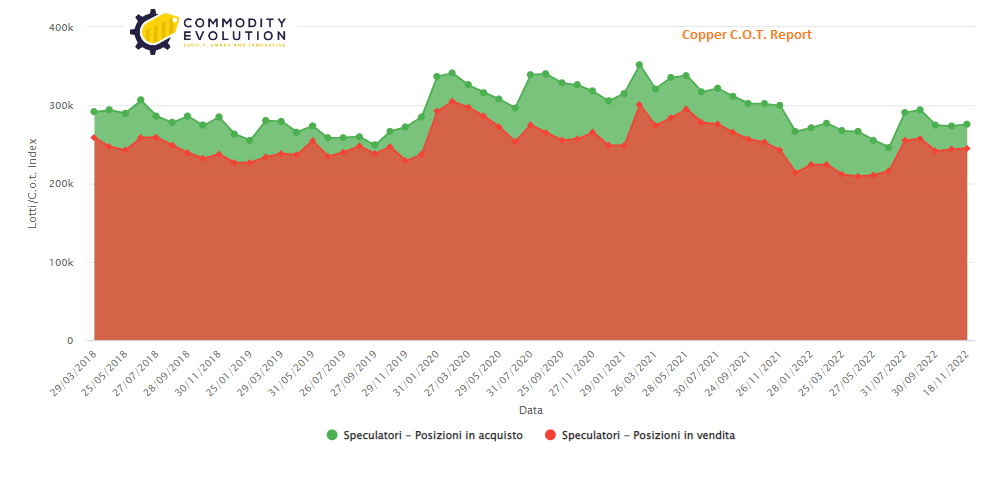 Different scenario for copper, where long positions rose 0.96 percent, as did short positions (of lesser intensity) to +0.35 percent. However, net positions climbed back to 30,964 lots, halfway to its highs at 75,000 lots. Possible continuation of the upward run for the Cot index as well.
Price projection: Positive
ZINC
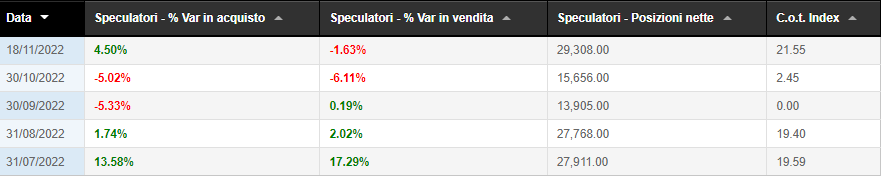
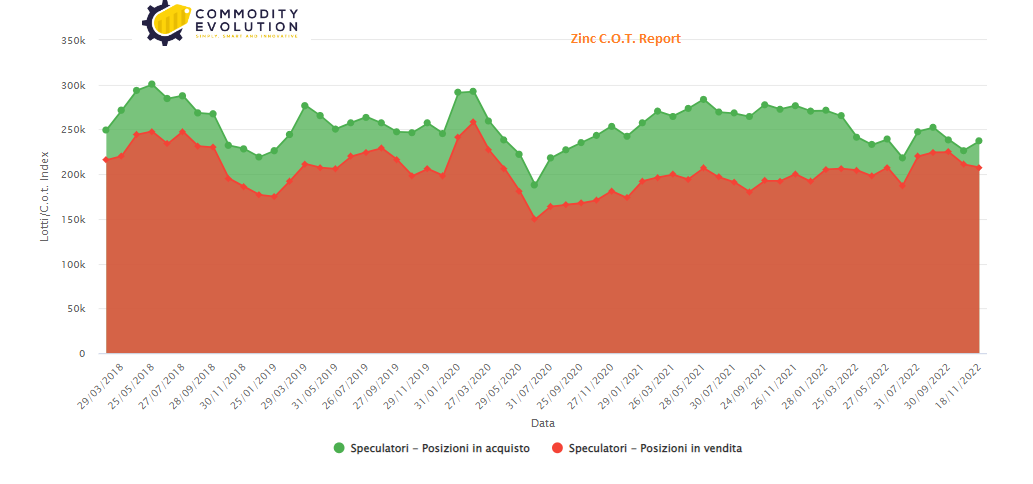 Unlike aluminum and copper, the situation for zinc is much more optimistic. In fact, analyzing the data, it can be seen that speculators’ long positions grew by 4.50 percent while short positions fell by 1.63 percent (note the asynchronous trend of the two lines – green goes up and red goes down). There was also an excellent recovery for net positions, which acquired another 13,652 lots, settling in the 29,308 lot area. Against this backdrop, the recovery of the Cot index leaving the 0% threshold suggests a decidedly positive scenario reflecting on prices.
Price projection: Strong positive
NICHEL

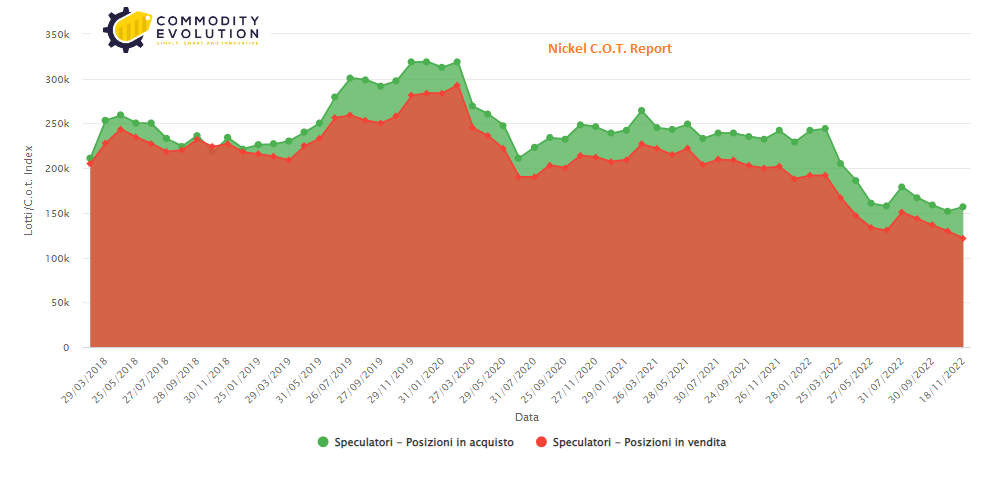 Nickel also shows very similar data trends to zinc, with speculators’ long positions up 3.26 percent while short positions near -6 percent, with the two lines clearly diverging. Net positions go up 12,721 lots to 35,104 lots. The Cot index continues to rise strongly (also dictated by the latest price spikes recorded on Nov. 14-15 that took nickel to $31,225/mt-near the highs of the last 3 months).
Price projection: Fairly positive
LEAD
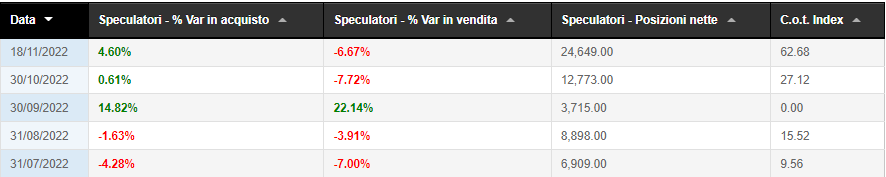
 Lead also shows a clear divergence between long positions (up in the last survey by 4.60 percent) versus short positions (down by -6.67 percent). Net positions in favor of buying return to the 24,649-lot area. The Cot index rises sharply from neutral, registering in the 62.68% area, over 18 days.
Price projection: Decidedly positive
STAGNO
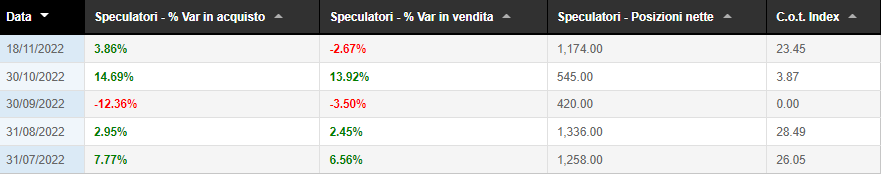
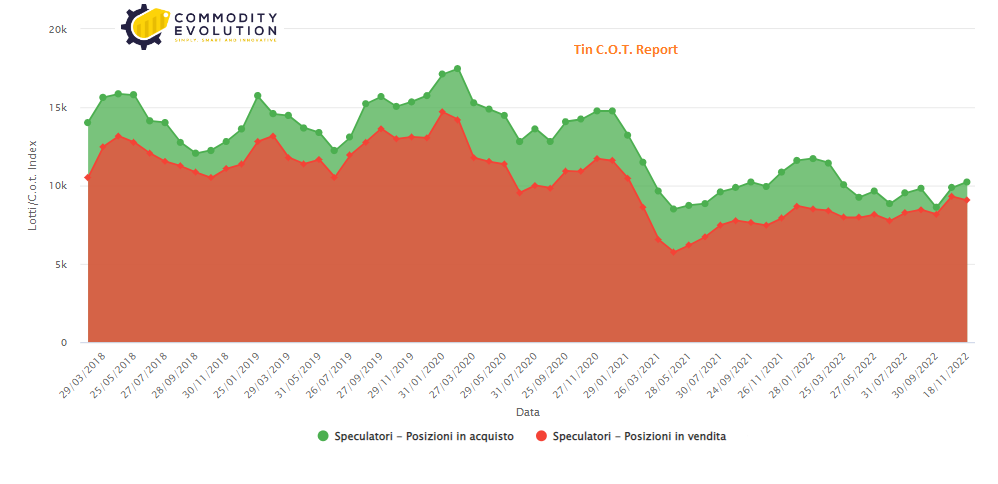
Also up sharply for speculators’ long positions, which record +3.86 percent compared to the -2.67 percent decline in short positions. Net positions rebound to 1,174 lots with the Cot index rebounding sharply.
Price projection: Definitely positive
The above analysis is for educational and disclosure purposes and does not constitute an appeal to the public for savings or solicitation of investment in any of the financial instruments that may be mentioned. The analysis provides support for understanding the market in question, which combined with other external indicators, could increase its reliability.
Report edited and elaborated by Commodity Evolution’s research department.