 Loading
 The current slump in 3-month dollar/tonne Lme copper prices is being influenced by fears of a global recession, which continue to grow and dampen demand prospects for the metal.
The sharp drop comes amid continuing concerns that China, which accounts for half of world consumption, will not recover quickly from Covid-related shutdowns, and as rising energy costs weigh on the European economy and cascading US inflation threatens a recession in the world’s largest economy.
However, for procurement professionals who need to source monthly contracts from their suppliers, this could be a good opportunity not to miss.
What to expect on the technical front
Copper’s ascent (from the March 2020 lows), after the formation of new lows since 2014, has twice reached the price level in the $10,850/mt area (10/05/2021 and 07/03/2022), forming what technical analysis experts call a double top.
This price pattern (of downward reversal) was completed at the violation of the trigger line at $8,790/mt, causing prices to plunge towards the minimum target of this figure at $6,955/mt (touched with maximum precision).
Analysing the monthly chart, it is possible to observe how the last candle (that of July), after having touched the target of the pattern (at 6,955 dollars/ton) is leaving a long shadow (from the minimum, prices are definitely reacting).
This movement could give early indications of potential technical rebounds, which would give some breathing space to the current descent of London prices. Also not to be overlooked is the latest Fibonacci retracement (61.8% – from the low at $4,369/mt in March 2020 to the high at $10,841/mt in March 2022), which provides an excellent support zone for prices ($6,850/mt area).
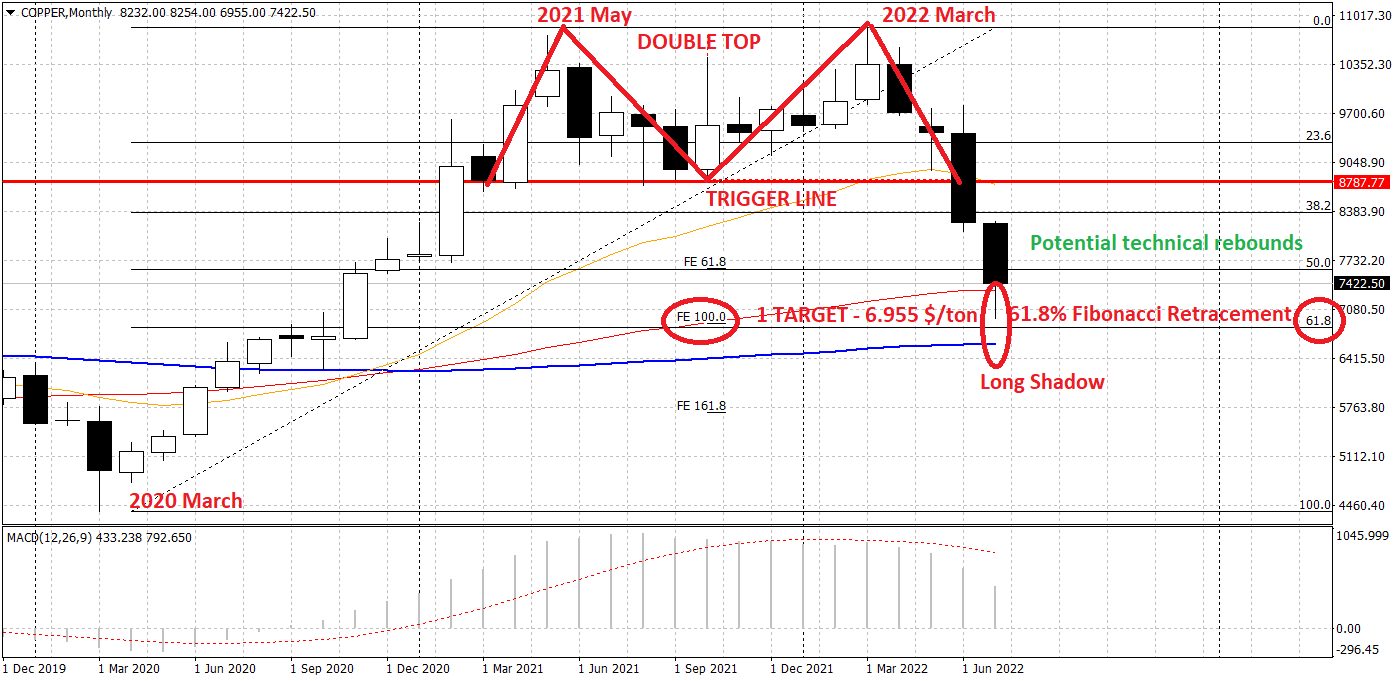
A possible target for the potential rebound can be estimated at around $1,000/mt from current prices ($7,440/mt 15:56 GMT+2) then towards the $8,500/mt area, without reversing for the time being the current negative trend from the March 2022 highs.
Seasonality confirms the technical picture
Before analysing the seasonal picture, a few concepts should be specified.
For those who work with commodities, a relevant element is the seasonality of the commodity under our attention, i.e. the periods of the year when statistically a given commodity rises or falls.
These systematic variations are linked to particular factors such as the weather for cereals or the demand for physical commodities by a particular state for example during religious holidays (see for example the increase in demand for physical gold during Indian or Chinese holidays – like the lower demand for metals during the Chinese New Year).
As previously written, we are talking about statistics and therefore it is not certain that the variations always repeat themselves in the same way with the passage of time, it will therefore be more than opportune not to rely only on this instrument, but to combine it with external indicators in order to increase its reliability.
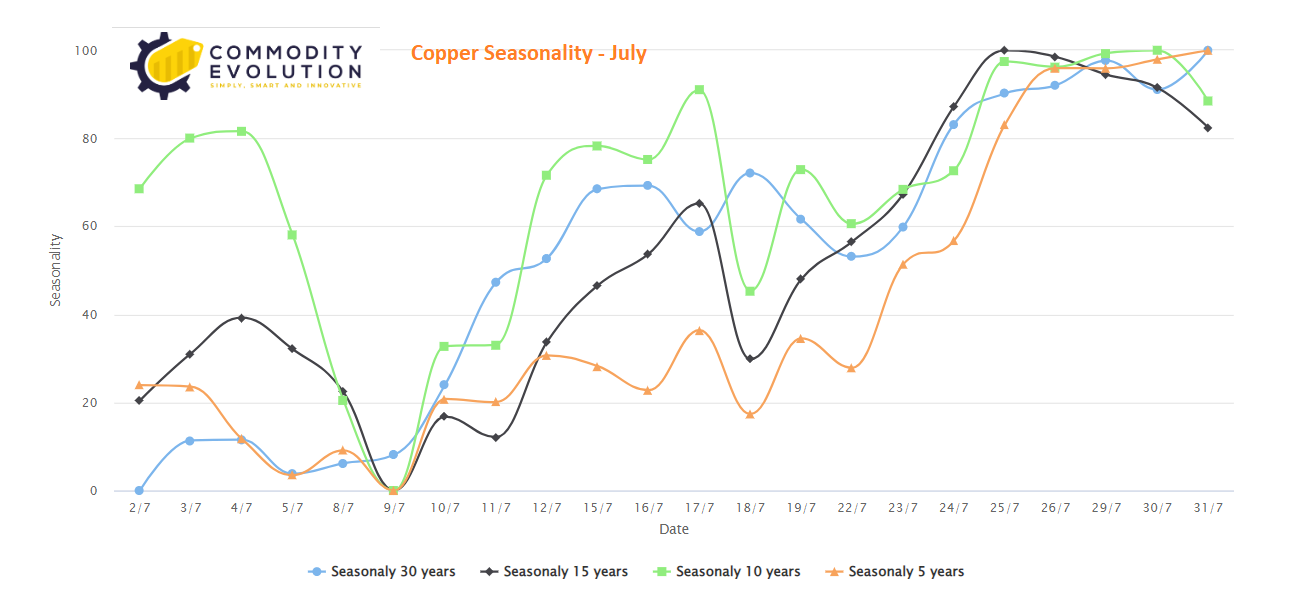
That said, the seasonality presented by Commodity Evolution has a historicity of 30 – 15 – 10 – 5 years. In fact, leaving aside the intermediate 15-year period, the other time horizons (30 – 10 – 5 years) move in sync. The first weeks of July, quotations historically have an average downward behaviour and then potentially recover ground from the second part of the month.
Stay tuned to Commodity Evolution for key industry market updates.
If you are not a subscriber and want to enjoy the full potential of the platform you can request a free trial of our services for 2 weeks Free trial or contact us to receive more information Contact us