 Loading

 Metals: Prices and Scenarios — Commodity Evolution’s Weekly Market Briefing Issue 7 | 12 November 2026
One supplier offers a fixed price; another uses a monthly copper average. Procurement needs to compare the same material, volumes, deliveries and additional cost components.
Historical portal averages make the calculation tangible. The essential steps are to distinguish the metal price from the full supply cost, identify the break-even threshold and measure the budget impact.
The Decision On 29 May
Assume a company already knows its June–October copper requirement in late May: 50 tonnes. On 29 May, it chooses to fix the full metal component at the daily reference of €11,686.42/t, supplied by Commodity Evolution, rather than use delivery-month averages.
In this hypothetical case, supplier A accepts the fixing for later deliveries without any additional charge for the price lock. Supplier B uses monthly ask averages of cash copper in euros. Both include the same €300/t for premium, processing, transport and other items: A therefore costs €11,986.42/t, while B uses monthly average + €300/t.
The Case: 50 Tonnes In Five Deliveries
Assume five monthly deliveries of 10 tonnes, identical quality and specifications, payment 60 days after delivery for both suppliers and no deposits. The €300/t addition stays unchanged throughout. Figures exclude VAT.
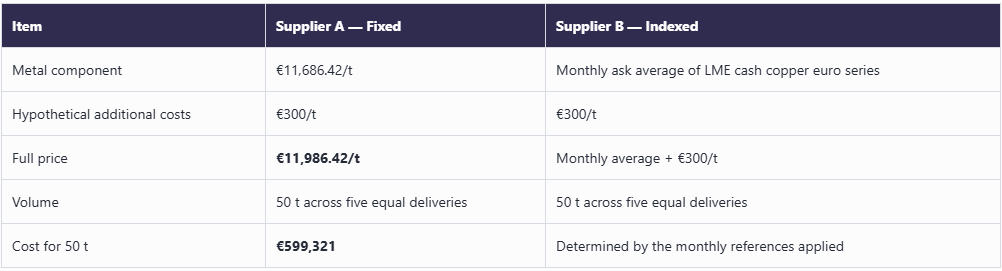
The 29 May daily price and June–October 2026 averages are data supplied by Commodity Evolution. Averages are LME cash copper ask, 14:30 fixing in €/t with Bloomberg currency conversion. The contract, €300/t addition and acceptance of the fixing without additional charges are illustrative assumptions, not a documented actual transaction. Deliveries remain monthly and payment follows each delivery; no early physical inventory purchase is assumed.
The Comparison Using Five Historical Averages
For each month, B’s cost equals the euro ask average plus €300/t, multiplied by 10 tonnes. Each delivery under A is valued at €119,864.20.
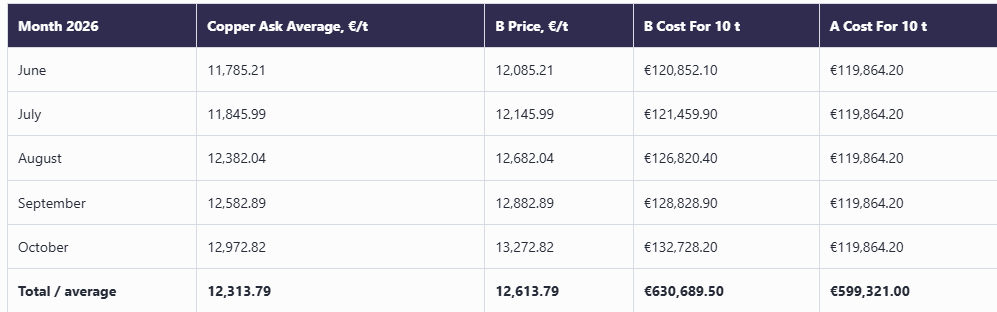
Over the observed period, fixing early costs €31,368.50 less than indexation. All five monthly averages exceed the 29 May reference; the average metal component difference is €627.37/t. This benefit is measured after the event: on 29 May, the company did not know the subsequent monthly averages.
The €12,313.79/t figure is the average of five monthly averages, appropriate for equal monthly volumes. It is not necessarily the average of all daily observations in the period, since months may contain different numbers of observations.
The Metal Component Break-Even Is €11,686.42 Per Tonne
Identical additions cancel out in the comparison: copper average + 300 = 11,686.42 + 300. The volume-weighted reference threshold is €11,686.42/t. B costs less below it; A costs less above it.

Illustrative scenarios with no assigned probabilities. Negative differences mean B costs less
Every €100/t change in the average copper reference changes the indexed cost of 50 tonnes by €5,000. For unequal monthly volumes, weight each reference by the corresponding tonnage.
Checks Before Choosing
The formula should specify the cash series, ask side, fixing, conversion and calculation calendar. Clarify whether it uses the delivery month or the previous month. Currency conversion is already included in a euro series and should not be added again.
Check offer validity, volume commitments and tolerances, any price thresholds and delivery-amendment costs. For a fixed-price customer order, knowing the purchase cost can make the margin more predictable; with indexed revenue, alignment between purchasing and selling formulas also matters.
Commodity Evolution provides quotations and historical averages to check formulas, invoices and budget sensitivity. Knowing the break-even threshold helps assess financial exposure alongside the offered price.
Commodity Evolution is the ideal solution to support the budgeting and negotiation activities of your corporate purchasing department.
Access to the platform allows you to view real-time prices and comprehensive market information for metals, steel, scrap, and many other sectors, with more than 1,500 products.
Request a Free Demo
Disclaimer
This document was prepared by Commodity Evolution. It is intended for consultation by those to whom it is addressed and, in any case, is not intended to replace the personal judgment of those to whom it is addressed. While Commodity Evolution has taken the utmost care in preparing this document and believes its contents to be reliable, it assumes no responsibility for the accuracy, completeness, or currency of the data and information contained therein or on the resources and data used to prepare it. Consequently, Commodity Evolution declines all liability for errors or omissions. The opinions, forecasts, or estimates contained in this document are expressed exclusively as of the date of this document’s preparation, and there is no guarantee that future results or any other future events will be consistent with the opinions, forecasts, or estimates contained herein. Any information contained in this document may be subject to changes or updates after the date of its preparation, without any obligation to communicate such changes or updates to those to whom this document has previously been distributed. This publication is provided to you for information and illustration purposes only and does not constitute a public offering of financial products or a promotion of investment services and/or activities, either to residents of Italy or to residents of other jurisdictions. Neither Commodity Evolution nor any of its directors, representatives, or employees assumes any liability, in whole or in part, for any damages (including, but not limited to, damages for loss of profits, business interruption, loss of information, or other economic losses of any nature) arising from the use, in any form and for any purpose, of the data and information contained in this document.