 Loading
 The global aluminium market is currently going through a phase of strong structural tension, with prices once again moving close to multi-year highs. In recent weeks the metal traded on the London Metal Exchange has recorded a new bullish acceleration, approaching the $3,500 per tonne area.
This dynamic is not the result of a single factor, but rather the convergence of several key drivers: rising speculative positioning, geopolitical tensions, energy pressure and signals of stress in the physical market.
The Commodity Evolution Aluminium Stress Index (CEASI) synthesizes these elements into a single market indicator. The latest reading of the model shows a value of 91.3 points, placing the market in the Extreme Stress category.
Such a level indicates that the market system is entering a phase in which supply, demand and financial flows begin to push in the same direction, increasing the probability of faster price movements.
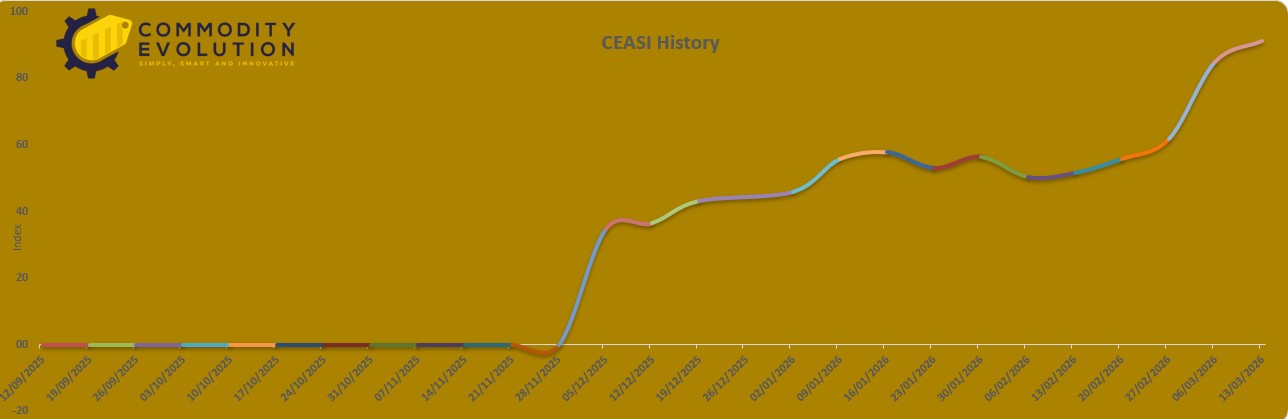
CEASI – Commodity Evolution Aluminium Stress Index – Powered by Commodity Evolution
LME Price: The Bullish Trend Remains Intact
The aluminium price chart shows a clearly bullish technical structure. After the weakness observed between 2022 and 2023, the market gradually built a sequence of higher lows and higher highs.
During 2024 and 2025 the metal experienced a steady recovery, supported by relatively solid industrial demand and a supply of metal that has not been particularly abundant.
This movement is also reflected in the CEASI dashboard: the Price Block currently registers the maximum value of 100 points, indicating that price levels and market momentum represent one of the main drivers of current market tension.
When the Price Block reaches such elevated levels, the model signals that the market is already in an advanced phase of the bullish cycle, where additional price acceleration may become stronger but also more unstable.
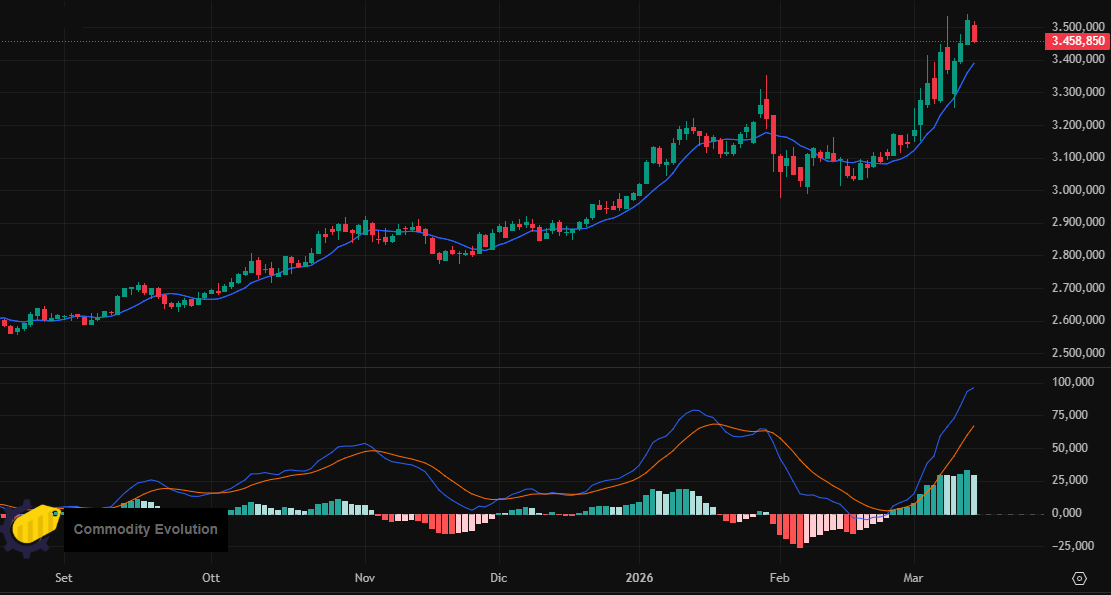
LME Aluminum – 3 month $/ton daily
The Physical Market Remains Extremely Tight
One of the most significant elements of the dashboard concerns the physical market.
The Premium Block also records a value of 100 points, indicating that regional premiums continue to reflect very strong demand for immediately available metal.
At the same time, the Stocks Block stands at 97.7 points, suggesting that global inventories are not providing significant relief to the market.
This combination — high premiums and relatively limited inventories — is typical of phases in which the market enters a condition of physical tightness, meaning that metal availability becomes progressively more limited relative to demand.
Under these conditions, even small supply shocks can amplify price movements.
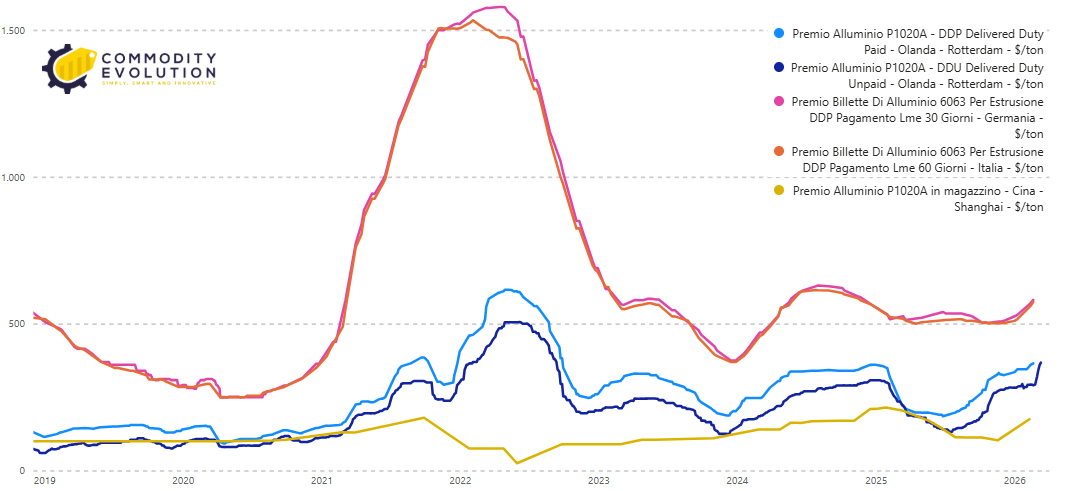
International Aluminum Premium in $ – Powered by Commodity Evolution
Speculators Are Increasing Exposure: The Signal From The COT
Another important element concerns the behavior of financial investors.
The COT Block of the CEASI currently registers 78.6 points, indicating a significant return of speculative positioning in the futures market.
Data on market positioning show a rise in net long positions held by hedge funds, suggesting that financial capital is returning decisively to the industrial metals sector.
When investors rapidly increase bullish exposure, market momentum often strengthens in the short term. At the same time, very elevated positioning levels may increase volatility if market sentiment changes suddenly.
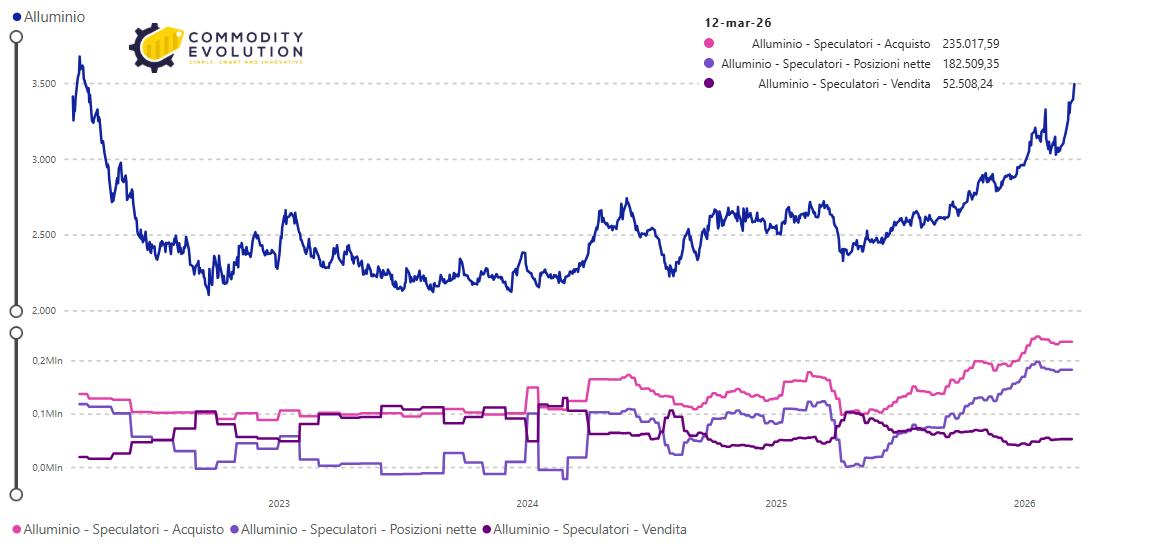
COT Report – Powered by Commodity Evolution
The Middle East Crisis Is Increasing Market Risk
Market tension is further amplified by the deterioration of the geopolitical environment.
The Geo Block of the CEASI currently registers 66.6 points, reflecting increased tensions in the Middle East linked to the conflict between the United States, Israel and Iran.
This crisis has renewed concerns about the Strait of Hormuz, one of the most important chokepoints in global trade.
Around 20% of global oil exports pass through this maritime corridor, along with significant volumes of natural gas and industrial raw materials.
For the aluminium market this factor is particularly relevant. The Persian Gulf hosts some of the largest aluminium smelters in the world, including those in the United Arab Emirates, Bahrain and Oman.
Any disruption to these shipping routes could have a direct impact on global metal supply.
Energy: The Factor That Can Change The Supply Balance
The model dashboard also highlights the role of energy.
The Energy Pressure Index currently stands at 71.8 points, indicating a relatively elevated level of energy pressure.
This indicator combines the price movements of:
-
Brent crude oil;
-
WTI crude oil;
-
European TTF natural gas.
Since aluminium production is extremely energy intensive, rising energy costs can reduce the profitability of smelters and limit the amount of metal available in the market.
This phenomenon is particularly visible in Europe, where several plants have reduced or suspended production in recent years precisely due to elevated energy costs.
CEASI Dashboard: The Signal From The Model
Overall, the CEASI dashboard shows a market experiencing a rapid deterioration in the balance between supply and demand.
The index currently stands at 91.3 points, well above the four-week average of 73.5 points. The weekly variation of the index is +24.2%, one of the fastest accelerations recorded in recent months.
This movement suggests that the aluminium market is entering a phase in which even small shocks can generate much larger price movements.
Seasonality: The Market Enters The Most Delicate Period Of The Year
Despite the structurally bullish environment, historical seasonality suggests that the aluminium market is entering the second quarter in a statistically less favorable phase.
The comparison of historical averages over the last 5, 10, 15, 20 and 30 years shows that the seasonal peak often forms between the end of the first quarter and the beginning of the second quarter.
The period between April and June more frequently records phases of consolidation or price corrections.
This means the market is entering Q2 with prices already at elevated levels, increasing the probability of short-term stabilization.
Scenario And Price Targets For Q2 2026
Based on signals coming from price action, seasonality, geopolitics and the CEASI, the aluminium market may enter the second quarter of 2026 in a phase of high-volatility consolidation.
The base scenario suggests a movement within a range between $3,300 and $3,650 per tonne.
A more bullish scenario could emerge if geopolitical tensions intensify or if logistical routes in the Persian Gulf experience significant disruptions. In that case prices could extend toward $3,750–$3,900 per tonne.
Conversely, if speculative positioning decreases and the weaker seasonality of the second quarter prevails, a corrective phase toward $3,200–$3,250 cannot be excluded. This area currently represents one of the main technical support levels for the market.
What To Watch: The Key Factors To Monitor In The Coming Weeks
Commodity Evolution è la soluzione ideale per supportare l’attività di budgeting e negoziazione del dipartimento acquisti aziendale.
Access to the platform will allow you to view real-time prices and comprehensive information on the metals, steel, scrap, and other markets, with more than 1,500 products.
Request a free demo with no obligation Free Trial
Disclaimer
This document was prepared by Commodity Evolution. This document is intended for consultation by the parties to whom it is addressed and, in any case, is not intended to replace the personal judgment of those to whom it is addressed. While Commodity Evolution has taken the utmost care in preparing this document and believes its contents to be reliable, it assumes no responsibility for the accuracy, completeness, or currency of the data and information contained therein or present on the resources and data used to prepare it. Consequently, Commodity Evolution declines all responsibility for errors or omissions. The opinions, forecasts, or estimates contained in this document are expressed solely as of the date of this document, and there is no guarantee that future results or any other future events will be consistent with the opinions, forecasts, or estimates contained herein. Any information contained in this document may be subject to changes or updates after the date of this document, without any obligation to communicate such changes or updates to those to whom this document has previously been distributed. This publication is provided to you for information and illustration purposes only and does not constitute a public offering of financial products or a promotion of investment services and/or activities, either to residents of Italy or to residents of other jurisdictions. Neither Commodity Evolution nor any of its directors, representatives, or employees assumes any liability, in whole or in part, for any damages (including, but not limited to, damages for loss of profits, business interruption, loss of information, or other economic losses of any nature) arising from the use, in any form and for any purpose, of the data and information contained in this document.