 Loading
Update as of September 29 – Industrial Metals Trends – October 2025
Non-ferrous metals moved in mostly positive territory in the past month, with a few exceptions reflecting the uncertainties of a still-fragile market. In dollar terms, zinc was the standout performer, posting a 6.06% jump over the course of a month, followed by copper with a robust 5.18% gain.
Lead also performed well (+0.54%) and nickel, which consolidated its upward trend with a modest but significant +0.13%. Tin declined slightly (-2.05%), while aluminum closed the month with a gain of 1.88%, despite experiencing weeks of ups and downs.
In euro, the picture is almost the opposite. Here too, zinc led the gains with a monthly gain of 5.98%, followed by copper (+5.10%) and lead (+0.46%). Aluminum closed up 1.80%, while nickel held steady (+0.05%). Tin, on the other hand, contracted by 2.12%, confirming the difficulties already evident in dollar prices.
The overall picture confirms a market in which metals – copper, zinc, and aluminum – continue to benefit from structural demand, while other segments remain exposed to macroeconomic turbulence and geopolitical tensions.
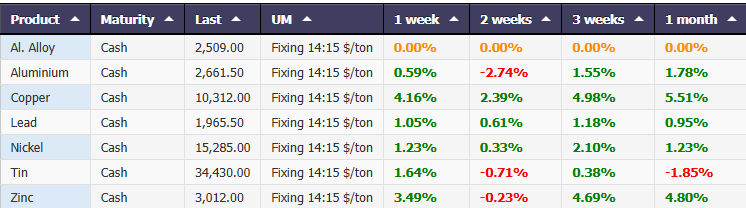
Metals Performance Cash $/ton
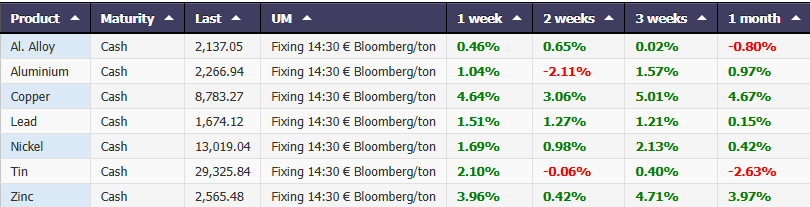
Metals Performance Cash €/ton Bloomberg
Production, Trade, and Premiums: Aluminum Between Stability and Global Uncertainty
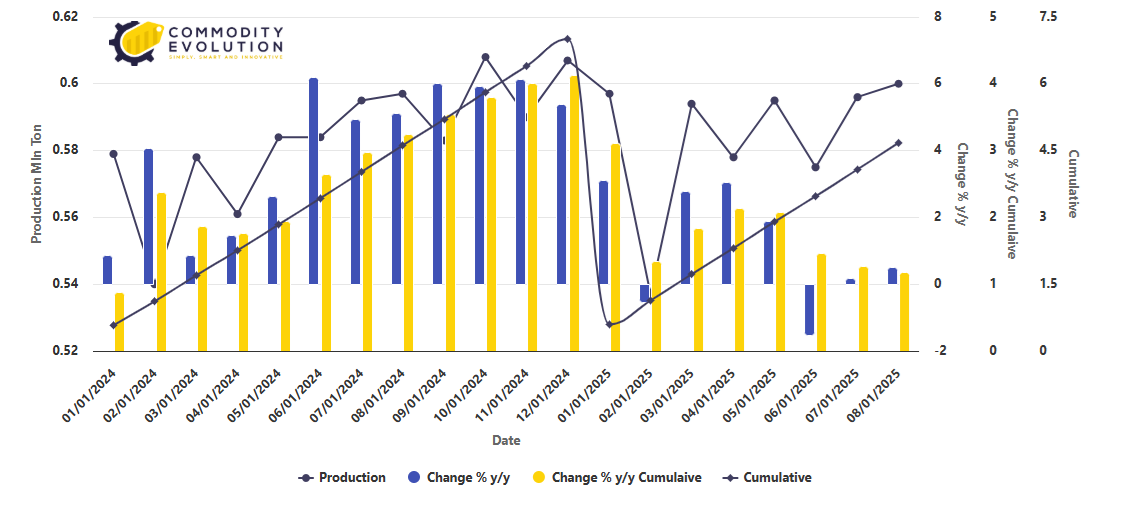
In August 2025, global primary aluminum production showed a sign of apparent stability, but behind the numbers lie more complex dynamics. According to the International Aluminum Institute (IAI), global production stood at 6.277 million tonnes, just above the 6.268 million tonnes recorded in July. This is a minimal increase, but on an annual basis it represents a 1% increase compared to the 6.222 million tonnes recorded in the same month in 2024.
In the period from January to August 2025, the cumulative figure shows more significant growth: 49.04 million tonnes, equal to a 1.32% increase compared to the previous year. The daily average, which rose from 202,200 to 202,500 tonnes, shows that progress in some areas was offset by slowdowns in others.
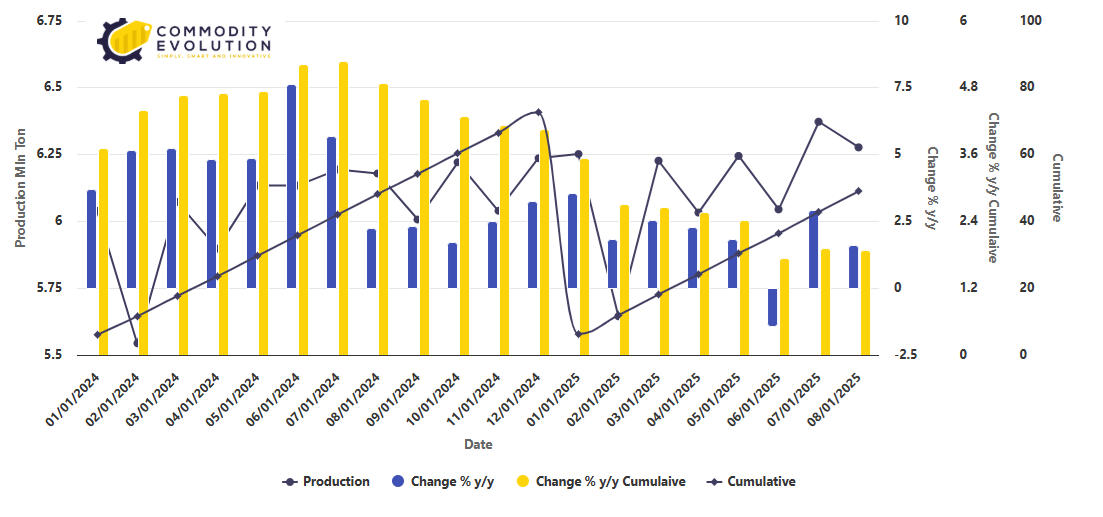
Global Aluminum Production – Powered by Commodity Evolution
China and South America Buck the Trend
Two market players have had a significant impact on global trends: China and South America.
In Latin America, production fell to 132,000 tons (-1.5% compared to July), signaling an unexpected slowdown. China, on the other hand, recorded 3.764 million tons, essentially stable on a monthly basis but up 3.26% compared to June, following the contraction at the beginning of the summer.
The Chinese figure, however, hides another significant phenomenon: the increase in the share of liquid aluminum in smelters, which rose to 75.07%. This reduced the volume of ingots produced, with a 10.38% decline year over year. In essence, less solid metal was released onto the market, to the benefit of production destined immediately for industrial processes.
China’s Aluminum Production – Powered by Commodity Evolution
A Moving Regional Puzzle
Looking at other producing areas, the picture is fragmented:
- Africa remains stable at 140,000 tons, but with a small increase compared to 2024;
- North America shows a slight recovery to 334,000 tons, despite a cumulative annual decline of 1.13%;
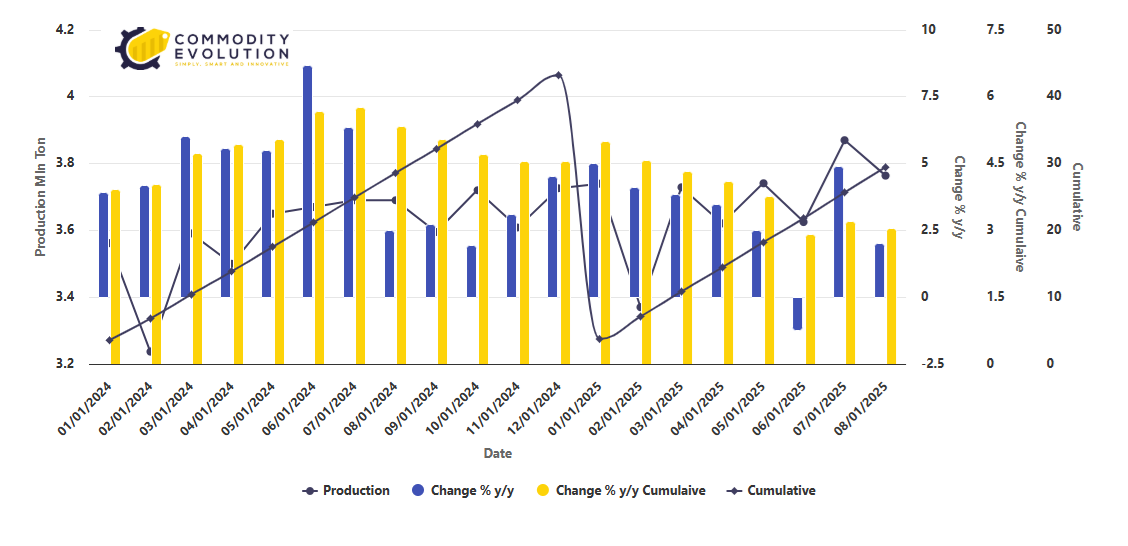
- Europe, including Russia, remains weak: 600,000 tons in August, down 1.15% compared to last year;
- Oceania grew by 7% (160,000 tons), while GCC and Asia ex-China declined moderately.
The first eight months show widespread progress: +4.6% in Africa, +1.98% in South America, +1.48% in Europe, and +2.28% in China. However, it is not enough to erase the feeling of fragility.
Aluminum Production in Europe (Including Russia) – Powered by Commodity Evolution
A Precarious Balance Between Supply and Demand
The global aluminum market is currently in a delicate phase. Production is growing but at a slow pace, with regional differences suggesting structural vulnerabilities. Any local disruption—be it a shutdown in South America or an environmental crackdown in China—can quickly reverberate globally.
Demand, driven primarily by energy and transportation, continues to surge. Precisely for this reason, the challenge for producers in the coming months will be to maintain adequate levels of efficiency and capacity, in a context marked by environmental constraints, energy costs, and geopolitical tensions.
China, Between Record Imports and Struggling Exports
While China remains the market’s driving force on the production front, unprocessed aluminum trade in 2025 tells a two-speed story: constantly growing imports and exports held back by geopolitical barriers and tensions.
In the first six months of the year, Beijing imported 2.1 million tons of unprocessed aluminum, up 2.4% compared to 2024. This is a modest increase compared to the boom in 2024, when imports soared 69.2% to 3.3 million tons. However, the figure confirms a trend: China continues to strengthen its supply base.
Driving demand are primarily construction and transportation, two sectors still expanding, along with the boom in bauxite supplies. In August alone, imports of this raw material reached 20 million tons, up 18.2% year-over-year, bringing the total for the first eight months to 141 million tons (+31.4%). This represents a strategic guarantee to support domestic aluminum production.
Russia Dominant, Malaysia Declining, Indonesia Recovering
The geography of suppliers has changed. Russia remains the main partner with 1.4 million tons in the first half of 2025. Malaysia is far behind with 256,000 tons, followed by Indonesia (103,400) and Thailand (75,500).
The comparison with the past is telling: Kuala Lumpur has halved its shipments compared to 2024, when they exceeded 600,000 tons, making way for Indonesia, which is returning to growth. This diversification is not accidental, but the result of a specific Chinese strategy, also dictated by tensions with the West and the need to maintain supply continuity.
Import Spikes, But Also Slowdowns
2025 has seen months of sharp fluctuations. In July, imports of unprocessed aluminum soared 38.2% year-over-year to 360,000 tons, driven by the domestic production cap of 45 million tons. In August, the positive trend continued, with +12.9% to 320,000 tons.
Not every month has been a success, however: in June, for example, alloy imports fell 12.3% year-over-year, driven by the reversal of the price differential between the domestic and foreign markets, which made it less profitable to buy from abroad.
Exports in Reverse
The weak side remains exports. In the first six months of 2025, China sold 272,900 tons of unprocessed aluminum abroad: better than 2024 (181,900 tons), but still far from the levels of a few years ago. After peaking in 2022, when exports soared 167%, the numbers are no longer convincing: 391,700 tons in 2023, falling to 363,400 in 2024.
The causes are multiple: anti-dumping measures imposed by India, tariff tensions with the United States, increasingly restrictive rules for global trade, and weak international demand.
Main Trade Outlets
Despite everything, some markets remain crucial for Beijing. Canada leads the ranking with 1.5 million tons, followed by the United Arab Emirates (328,400), South Korea (170,100), and India (143,500). Bahrain, Argentina, and Oman follow.
The dependence on a few established outlets—already evident in recent years—is confirmed today. In 2024, for example, Canada alone absorbed over 3.2 million tons.
A Challenge for the Future
For Beijing, the challenge is clear: continue to secure raw materials and unprocessed aluminum from abroad to sustain production, while simultaneously finding new markets for its currently struggling exports. Diversification of partners and greater vertical integration of the domestic supply chain will be decisive levers for reducing vulnerability and dependence on fragile trade balances.
Premiums Rise in Europe, Steady but Record High in the United States
While China seeks to balance imports and exports, on the other side of the world, the aluminum premium market is showing diverging dynamics between Europe and the United States.
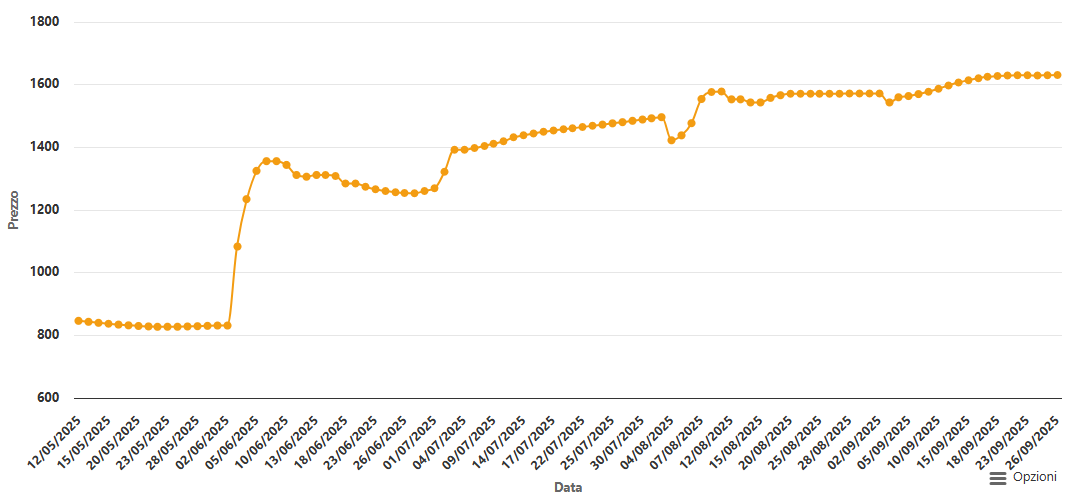
In Rotterdam, in the week ending September 23, the duty-paid premium rose to $235-$260/t, up from $225-$250/t the previous week. Some trades reached $255/t, with even one extra-large deal at these levels.
The arrival of numerous ships from Canada has eased pressure on buyers, while the backwardation on the London Metal Exchange has prompted several traders to sell off some of their inventories.
P1020A Aluminum Premium – DDP Rotterdam – Powered by Commodity Evolution
“Ships from Canada are arriving at a rapid pace,” confirmed a European trader. Today, it is more convenient to ship to Europe than to the United States, where premiums, although at their highest, do not offer the same competitive advantage.
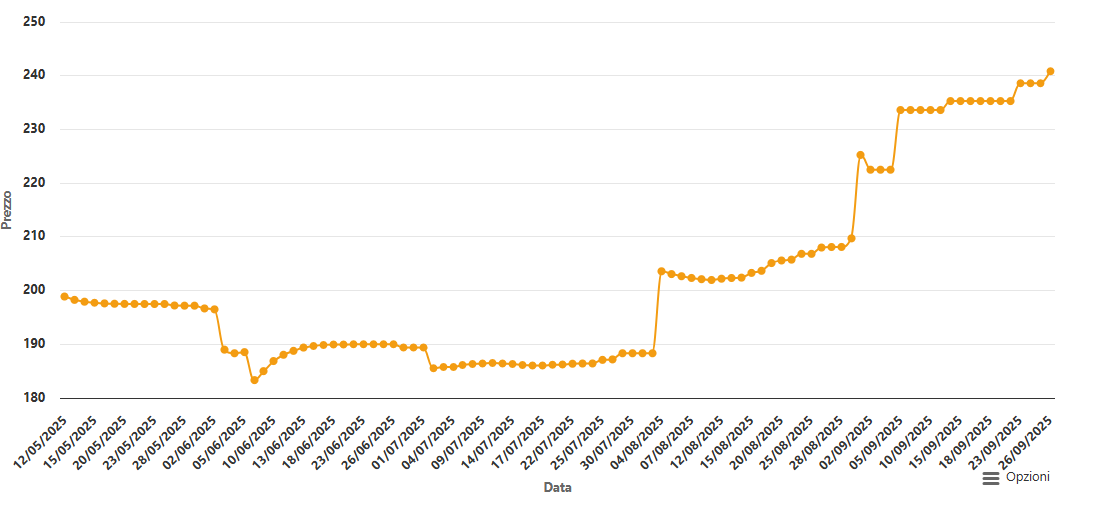
In the United States, the Midwest premium remains stable but at record levels: $1,631/ton as of September 26, according to Commodity Evolution. This value, according to operators, is not enough to stimulate new shipments, given that the convenience threshold is around $1,720/ton.
Complicating the situation are the 50% Section 232 tariffs, which everyone expects to remain in place until the end of the year. “No one believes they will be eliminated,” commented an American trader, highlighting how US trade policy is weighing on the 2026 contract negotiations.
Aluminum Premium – P1020A DDP USA Mid West $/ton – Powered by Commodity Evolution
Rotterdam and Italy: Comparing Two Scenarios
While metal availability has improved on the European duty-paid market, operators on the duty-unpaid market are holding firm, convinced that premiums could rise further. Commodity Evolution valued duty-unpaid at $160-185/t, up from $155-180/t the previous week.
In Italy, however, the premium remained frozen at $245-275/t FCA. Buyers resisted the increases, arguing that the boost was coming more from Rotterdam than from still-sluggish local demand.
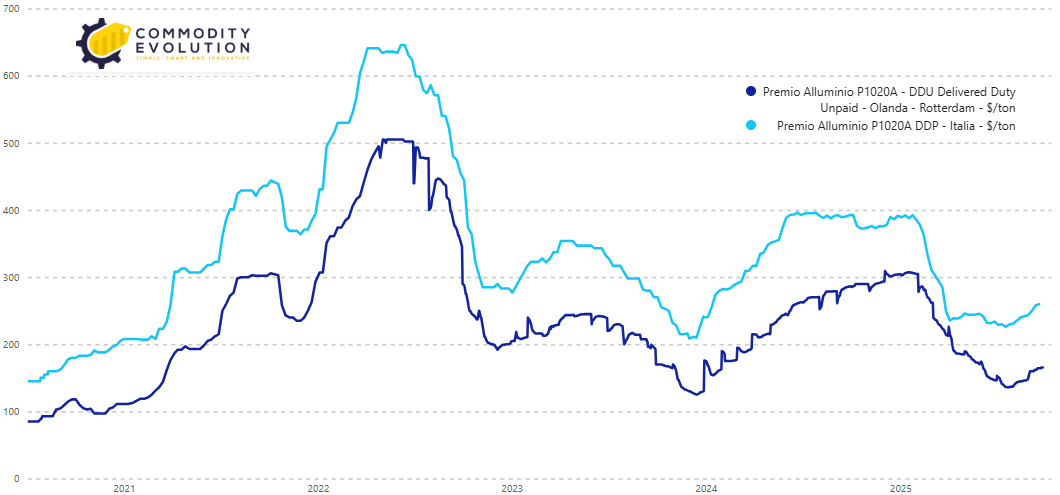
Aluminum Premium P1020A DDU Rotterdam VS P1020A DDP Italy $/ton – Powered by Commodity Evolution
The Impact of Backwardation and Traders’ Strategies
The London market continues to influence traders’ moves. The LME three-month cash spread, although reduced from $8.75/t to $3/t, remains a hurdle. Some traders have stated that they are reluctant to open new positions precisely because of the volatility, preferring to wait until October for deferred deliveries.
“There is no longer any possibility of buying below $160/t,” explained a European trader, a sign of bullish sentiment that contrasts with the caution of many buyers.
A Global Market in the Balance
The overall picture of P1020A premiums reflects a global market in precarious equilibrium. Europe is seeing premiums rising thanks to arrivals from Canada and seller confidence, while the United States remains stuck at record levels but lacking momentum, held back by trade policy and transportation costs.
The big unknown concerns the near future: will Europe, with its bullish momentum, drag the US toward further increases, or will the United States impose a global brake, forcing European premiums to retreat?
In a context of LME volatility and geopolitical tensions, much will depend on Washington’s next moves and Beijing’s decisions regarding international supplies.
LME Aluminum: A Final Quarter Between Consolidation and a Possible Revival
After a year marked by sharp corrections and gradual phases of recovery, aluminum approaches the final quarter of 2025 with a complex but potentially favorable picture.
The chart clearly shows how, after the spring crash that pushed prices below $2,300/t, the metal has embarked on a slow but steady recovery. The consolidation phase between July and September, hovering around $2,600-$2,700/t, signals that the market is seeking a new equilibrium, supported by both the recovery in industrial demand and the strengthening of physical premiums in Europe.
Technical Signals: A Solid Foundation for a Rebound
Technical analysis offers some key insights. The short moving average remains positively sloped, while the MACD indicator – although reduced from its summer peaks – maintains a neutral-bullish bias, suggesting that downward pressure is currently limited.
In practical terms, this means that the $2,600/t level is consolidating as primary support. As long as prices remain above this threshold, the market will be able to attempt further upward moves. The first resistance lies at $2,720-$2,750/t, an area already tested in September.
A clear breakout would pave the way for more ambitious targets of $2,800-$2,850/t, a level that would represent the maximum potential for this quarter in the event of positive sentiment.
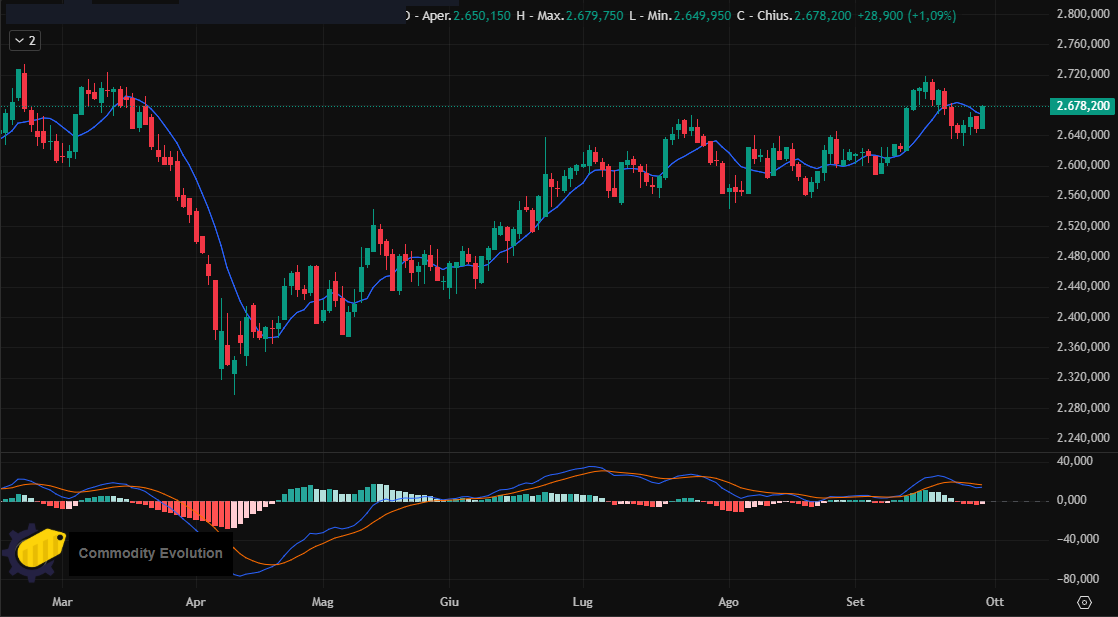
LME Aluminum – 3 Month $/ton
Outlook for Q4 2025
Looking ahead to the next three months, the most likely scenario is a market moving within a bullish consolidation range. Barring geopolitical shocks or sudden drops in demand, prices should remain above $2,600/t, with the potential to reach new highs for the year.
Aluminum is set to close 2025 in relative stability, with a slightly bullish trend that appears set to consolidate. After months of oscillating around the $2,600/t threshold, the market has found a balance that leaves room for gradual strengthening.
The most realistic scenario for the final quarter sees prices moving in a range between $2,700 and $2,750/t, with some upward surges supported by European demand and cautious Chinese production. Barring geopolitical or macroeconomic shocks, it is difficult to imagine a return below $2,600/t: this level now appears to be consolidated as a key support level.
Q4 should therefore be characterized by a phase of bullish consolidation, with Europe at the forefront of supporting physical premiums and a global context that, while uncertain, shows no signs of a drastic weakening in demand.
The outlook is uncertain and will depend both on regulatory moves and macroeconomic trends in the second half of the year.
Commodity Evolution is the ideal solution to support the budgeting and negotiation activities of the corporate purchasing department.
Access to the platform will allow you to view real-time prices at any time and a lot of information relating to the market of metals, steel, scrap and many other reference sectors, with more than 1,500 reference products.
Request a Free demo of our platform for one week
Disclaimer
This document has been prepared by Commodity Evolution. This document is intended for consultation by the subjects to whom it is addressed, and, in any case, is not intended to replace the personal judgment of the subjects to whom it is addressed. Although Commodity Evolution takes the utmost care in preparing this document and considers its contents to be reliable, it does not assume any responsibility for the accuracy, completeness and timeliness of the data and information contained or present on the resources and data used for the purposes of its preparation. Consequently, Commodity Evolution declines all responsibility for errors or omissions. The opinions, forecasts or estimates contained in this document are formulated with exclusive reference to the date of drafting of this document, and there is no guarantee that future results or any other future event will be consistent with the opinions, forecasts or estimates contained herein. Any information contained in this document may, after the date of drafting of the same, be subject to any modification or update, without any obligation to communicate such modifications or updates to those to whom this document has previously been distributed. This publication is provided to you for information and illustration purposes only, and does not constitute in any case an offer to the public of financial products or promotion of investment services and/or activities either towards persons resident in Italy or persons resident in other jurisdictions. Commodity Evolution, nor any of its directors, representatives or employees assume any type of liability, in whole or in part, for damages (including, by way of example, damages for loss or lack of earnings, interruption of business, loss of information or other economic losses of any nature) arising from the use, in any form and for any purpose, of the data and information contained in this document.