 Loading
 Looking at the 3-month LME zinc price chart, a key support emerges in the $2,630/mt area. This level corresponds to the 61.8% Fibonacci retracement drawn from the rise from the mid-February 2024 lows. This support also coincides with the transit area of the 200-day moving average (red colour), giving further technical significance to this level.
The 200-day moving average is a key long-term indicator and its coincidence with the Fibonacci retracement reinforces the validity of this support. Holding this level is crucial to avoid further price declines.
Positive MACD Divergence
Another notable element is the positive divergence of the MACD indicator from prices. As prices continued to fall from the highs of 21 May 2024, the MACD started to show signs of slowing down the descent. This phenomenon suggests a potential trend change, indicative of a possible recovery or at least a consolidation phase.
Positive divergence occurs when the MACD indicator starts to rise while prices continue to fall. This is a sign of weakening selling pressure and may herald a rebound in prices.

LME Zinc – 3 month $/ton daily
Seasonal Analysis
Historically, from July to mid-August, zinc prices tend to record a major low on an annual basis. This seasonal pattern is supported by historical data and reinforces the hypothesis of a possible short-term price rebound.
Buyers often consider these seasonal patterns as part of their analysis, as they can provide useful indications of possible price movements.
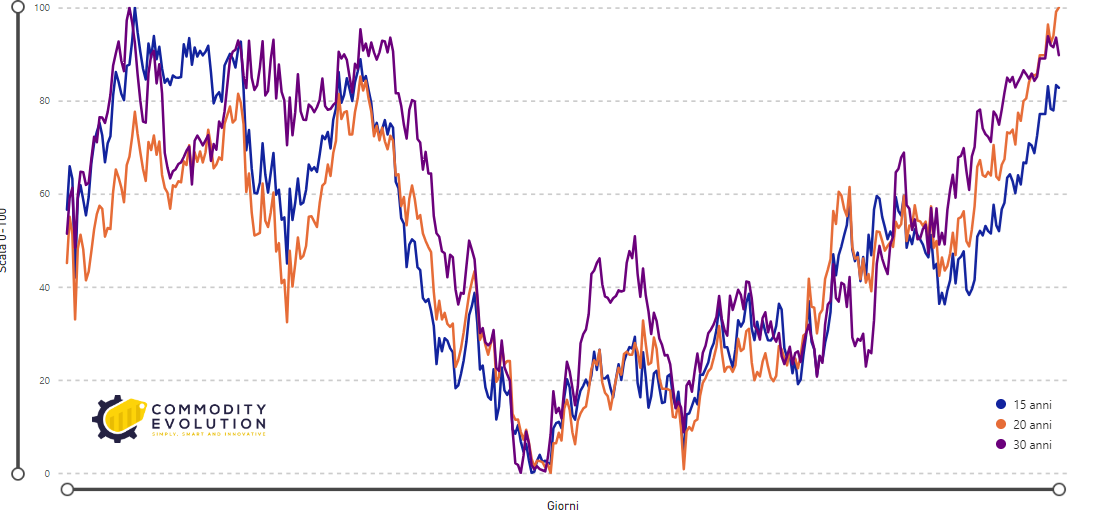
Zinc on a 0%-100% basis – Seasonality – Powered by Commodity Evolution
COT Report and Speculative Positioning
On the speculative front, the COT (Commitment of Traders) report suggests that large funds, despite having liquidated some of their buy positions since late May 2024, still remain net bullish. Net positions at +18,910 lots indicate a prevalence of positive sentiment among large investors.
This speculative positioning may act as a support for prices, helping to prevent further significant declines.

LME Zinc – C.O.T. Report – Powered by Commodity Evolution
Future Outlook
In light of these elements, zinc prices are estimated to settle near the current support in the $2,630/mt – $2,700/mt area before generating a technical rebound. The first areas of resistance are in the $2,800/mt area, and a breach of this level could pave the way for further increases.
The maintenance of the support in the 2,630 $/ton area is fundamental to confirm the rebound hypothesis. A breach of this level could instead lead to a new phase of price weakness, with bearish targets to be identified.
In conclusion, the 3-month zinc price chart shows technical signals with a prevalence of elements suggesting a possible price rebound. Fundamental support, positive MACD divergence, seasonal pattern and favourable speculative positioning all contribute to this view.
Buyers should closely monitor price behaviour against the identified support and resistance levels, ready to adjust their strategies accordingly. A rebound in prices towards $2,800/mt could offer interesting opportunities, while a breach of key support would require a revision of bullish expectations.
The evolution of zinc prices in the coming months will be influenced by a combination of technical, fundamental and speculative factors, making continuous and detailed market analysis essential.
Disclaimer
This document has been prepared by Commodity Evolution. This document is intended for consultation by those to whom it is addressed, and, in any event, is not intended to replace the personal judgment of those to whom it is addressed. While Commodity Evolution has taken the utmost care in the preparation of this document and considers its contents to be reliable, Commodity Evolution nevertheless assumes no responsibility for the accuracy, completeness and timeliness of the data and information contained in or present on the resources and data used for the purpose of its preparation. Accordingly, Commodity Evolution disclaims all liability for errors or omissions. The opinions, forecasts or estimates contained in this document are made with reference only to the date of preparation of this document, and there can be no assurance that future results or any future events will be consistent with the opinions, forecasts or estimates contained herein. Any information contained in this document may, subsequent to the date of preparation of this document, be subject to any changes or updates, without any obligation to notify those to whom this document was previously distributed of such changes or updates. This publication is provided to you for information and illustration purposes only and in no way constitutes an offer to the public of financial products or promotion of investment services and/or activities either to persons residing in Italy or to persons residing in other jurisdictions. Commodity Evolution, nor any of its directors, representatives or employees assumes any liability whatsoever, in whole or in part, for any damages (including, without limitation, damages for loss or loss of profits, business interruption, loss of information or other economic loss of any nature whatsoever) arising out of the use, in whatever form and for whatever purpose, of the data and information contained in this document.