Loading
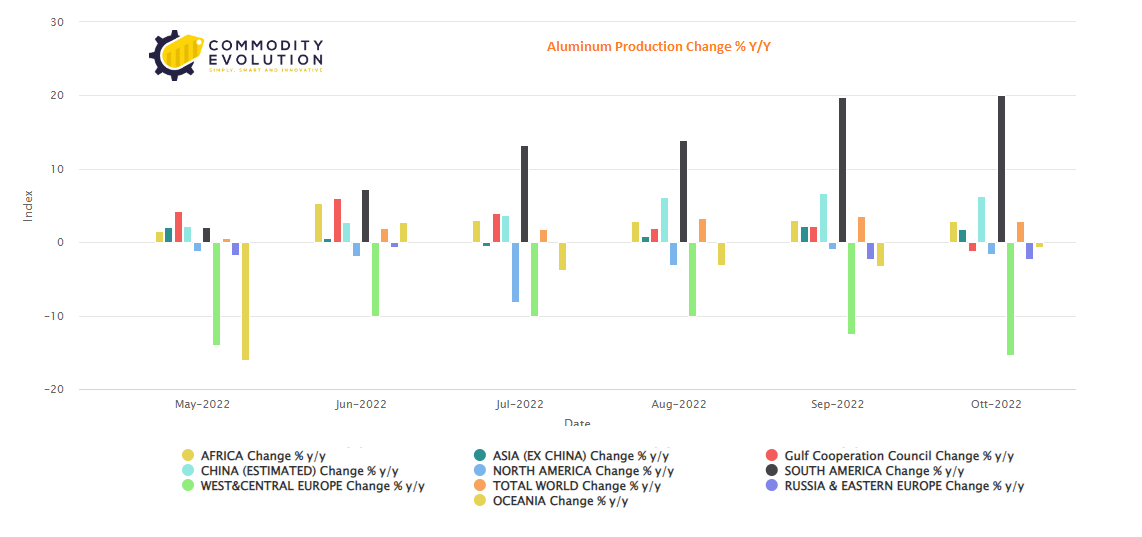
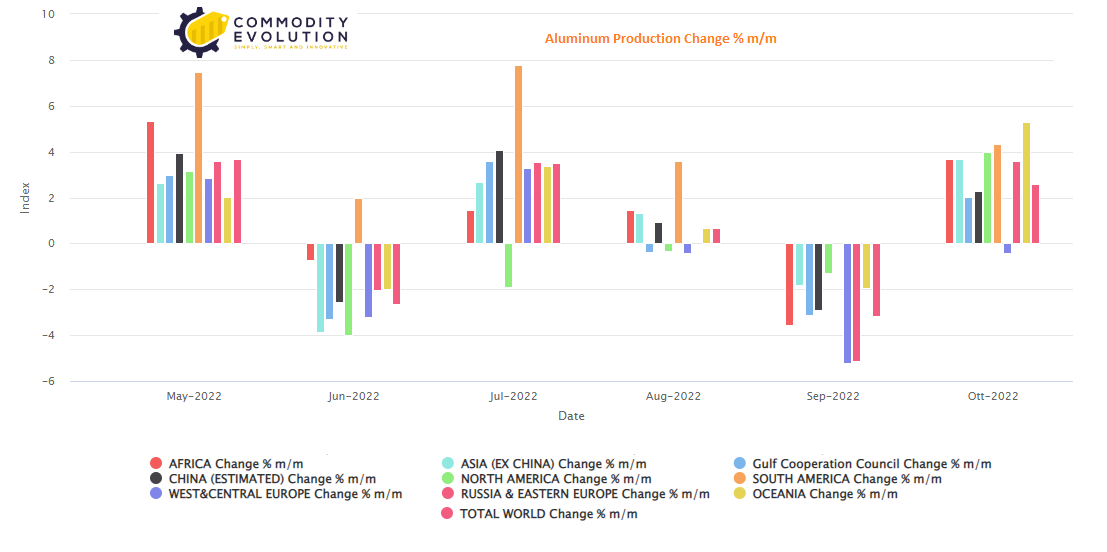
The following is the October 2022 production data for primary aluminum, released by the International Aluminium Institute and processing by Commodity Evolution’s research department.
| Area | Production | Change m/m | Change y/y |
| AFRICA | 141 k tons | 2,92% | 3,68% |
| ASIA (EX CHINA) | 394 k tons | 1,81% | 3,68% |
| Gulf Cooperation Council | 508 k tons | -1,17% | 2,01% |
| CHINA (ESTIMATED) | 3.475 mln tons | 6,27% | 2,27% |
| NORTH AMERICA | 313 k tons | -1,57% | 3,99% |
| SOUTH AMERICA | 120 k tons | 20% | 4,35% |
| WEST&CENTRAL EUROPE | 236 k tons | -15,41% | -0,42% |
| TOTAL WORLD | 5.85 mln tons | 2,83% | 2,60% |
| RUSSIA & EASTERN EUROPE | 344 k tons | -2,27% | 3,61% |
| OCEANIA | 159 k tons | -0,62% | 5,30% |