 Loading
Great upward momentum for London-listed aluminum, with prices now in the $2070 area, approaching the recent highs of late December 2020 at $2090/ton. Possible new tests of this level.
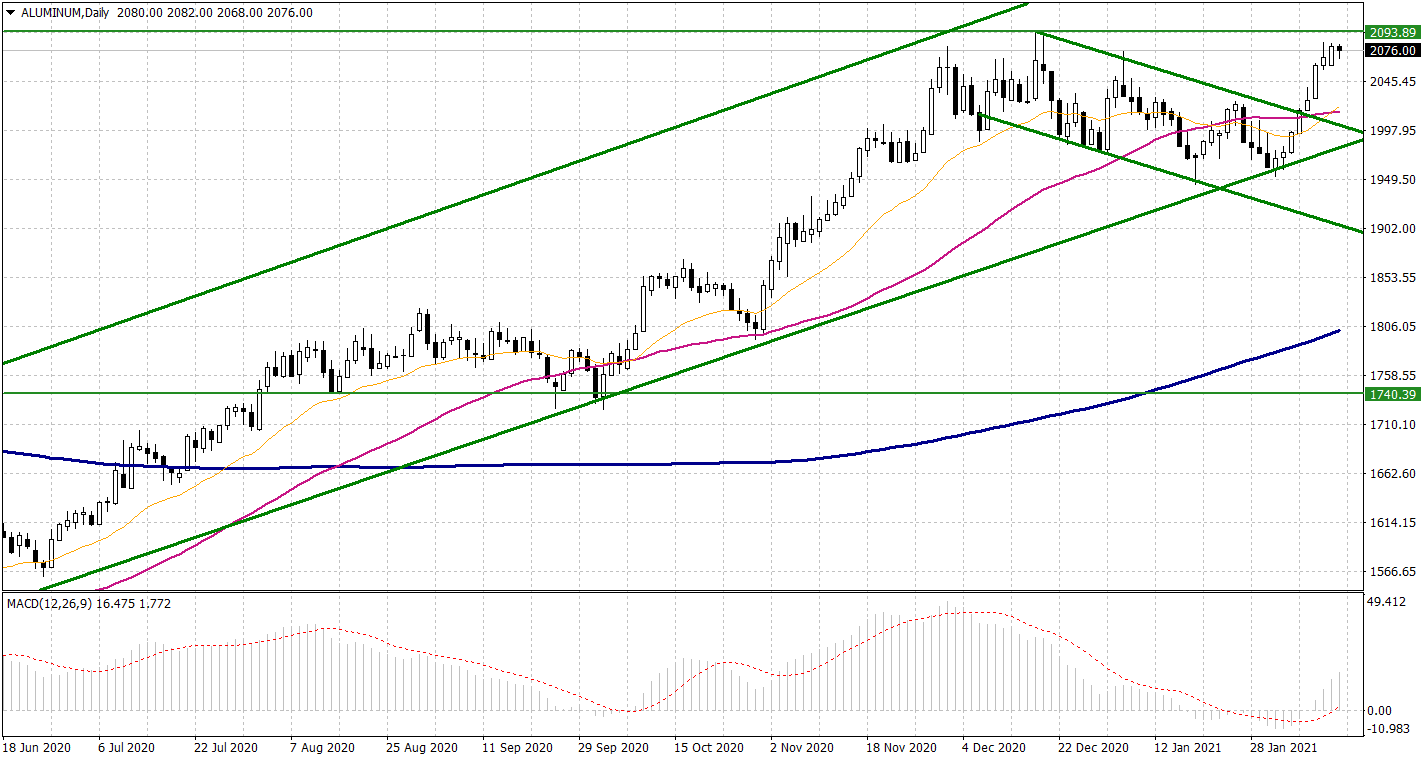
Will prices succeed in to the break up or will there be new reversals?
Analyzing the chart side, the 2090$ area is of fundamental importance. Prices are above all the main dynamic supports (moving averages of different time horizons) and this should be positive for the rise of prices.
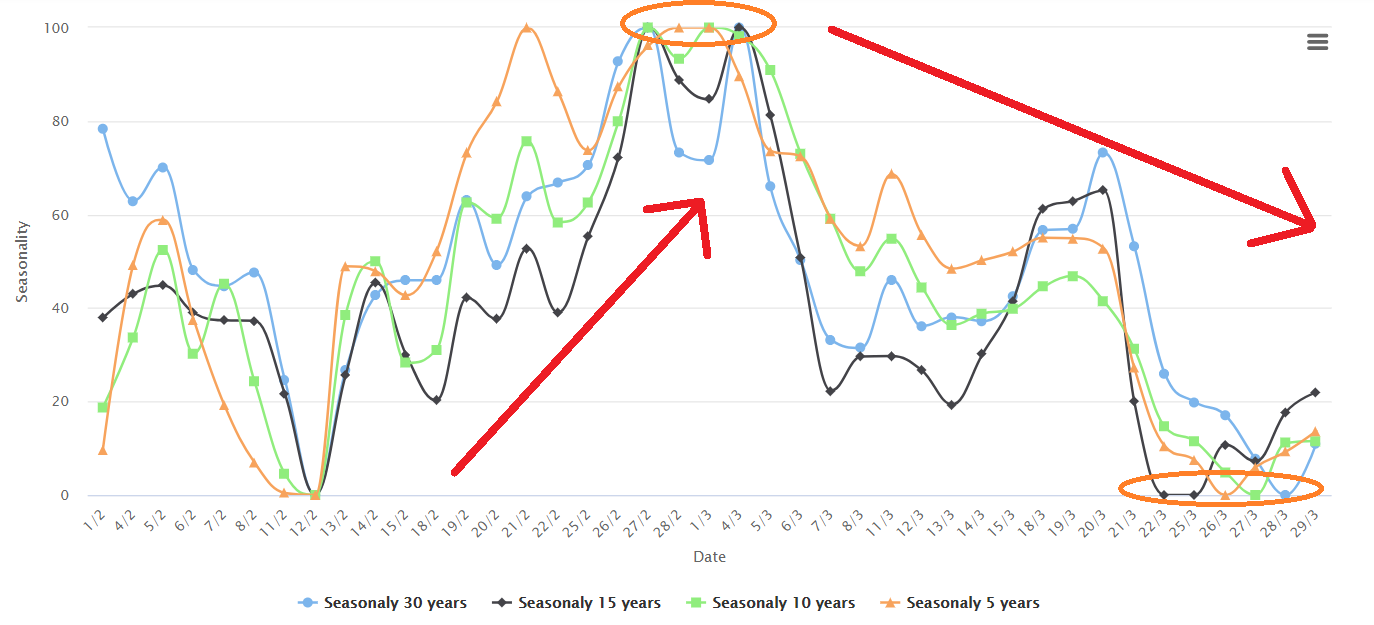
It is worth noting that on a weekly basis the MACD indicator has started to flex slightly (still in the positive area but with a small yield on the strength front). At a seasonal level, on the major historicity calculated on a monthly basis (30 – 15 – 10 – 5 years), the second part of February shows a tendentially strong trend, while in March the statistical trend is downward.
This is also confirmed by the indicator “Probability of Maximum/Minimum Formation” where the probability of forming a high in the first week of March is 52%, very high.
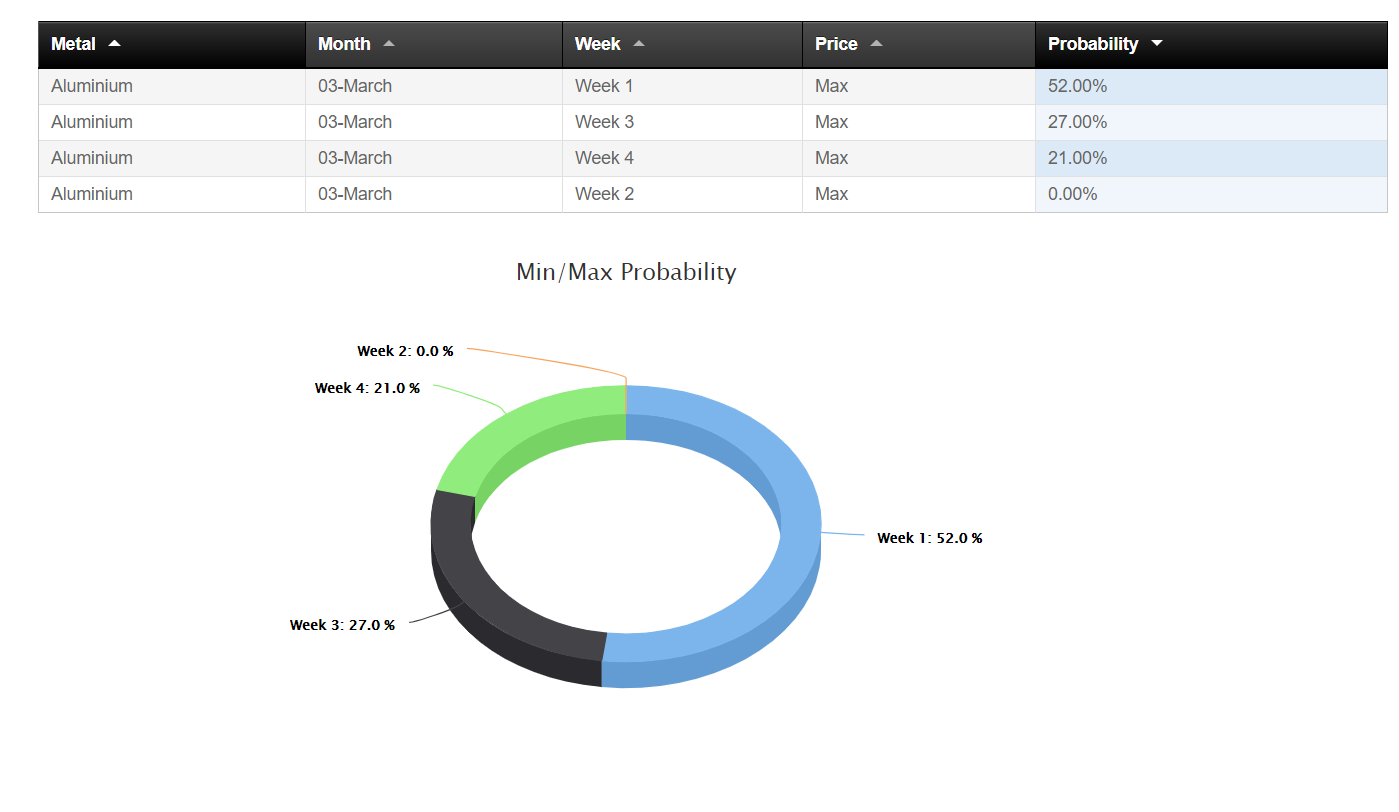
So possible test of 2090$ area within the end of February and then possible negative phase for the following month.